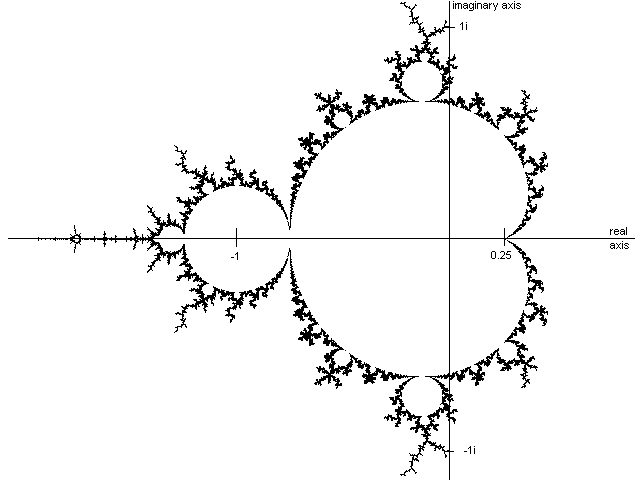
We will use the Mandelbrot Set as an example of a load balancing problem as discussed in lectures.

The image is generated from values associated with a set of points in the complex plane. The points are quasi stable with values that are computed by iterating the function Zk+1 = Zk2 + C, where Z and C are complex numbers (i.e. Z = A + Bi), with Z initially set to zero and C is the position of the point in the complex plane. Iterations of the above continue until either |Z|>2 or some arbitrary iteration limit is reached (|Z| = sqrt(A2 + B2)). The set of points are enclosed by a circle centered at (0,0) of radius 2.
A slightly modified program to evaluate the Mandelbrot set is
contained in mandel.c. Computing a Mandelbrot pixel as
implemented takes from 1 to 256 iterations. However even when 256
iterations are required the total time taken is still very
small. Hence the code has been modified to do some extra work that is
given by the square of the number of Mandelbrot iterations. The extra
work is purely to increase task time so we have a meaningful load
balancing problem.
The program requires as input:
NOTE: To ensure the point is enclosed within the circle of radius 2 the values of Rx/Ry_Min/Max should be between -2 and +2. The Mandelbrot computation is run Nexpt times and the minimum time is printed out. This should minimize the need to run the computation several times.
The code is written to solve the Mandelbrot problem twice, first sequentially, and then in parallel. We time both, and for a sanity check verify that the results from the sequential code are identical to those from the parallel computation. You should only change the parallel part of the code.
Run the code: mpirun -np 1 mandel
with input
10 10
-2 2
-2 2
4
to make sure it works.
For problem sizes with Nx and Ny less than or equal to 50 the resulting pixels are printed. This is really just for interest. A small gnuplot script mandelbrot.plot is included, which plots data for a file named mandelbrot.dat: you can use it to visualize your output by running:
module load gnuplot
./mandel < mandel.in > mandelbrot.dat
gnuplot < mandelbrot.plot
Note that you might need to use ssh -X ... to connect to Raijin, in order for X11 to forward the window generated by gnuplot. In the above, the input data is read from file mandel.in. For what follows you might find it more convenient to always read the input data from a file rather than retype it each time.
Can you see that the printout looks something like the picture above (noting that the center of picture should be black)?
     #1 Nx=100, Ny=10, Rx_min=-2, Rx_max=0, Ry_min=-2, Ry_max=0, Nexpt=10
     #2 Nx=10, Ny=100, Rx_min=-2, Rx_max=0, Ry_min=-2, Ry_max=0, Nexpt=10
     -----------------------------------------------------------------
                              Number of MPI processes and cores used
     Input  Time          1        2        4        8
     -----------------------------------------------------------------
     #1     Sequential             -        -        -
     #1     Parallel
     #1     Speedup
     #2     Sequential             -        -        -
     #2     Parallel
     #2     Speedup
     -----------------------------------------------------------------
Both data sets have the same number of data points and the same Rx/y
min/max values. Explain why the performance is so different. (Hint:
it may help to run this region for a smaller number of data points so
that it prints out their values). Your answer should include comments
based on how the code has been parallelized.
     -----------------------------------------------------------------
                     MPI      Number of MPI processes and cores used
     Input  Time     Rank       2           4           8
     -----------------------------------------------------------------
     #1     Parallel   0
                       1
                       2        -
                       3        -
                       4        -           -
                       5        -           -
                       6        -           -
                       7        -           -
     #2     Parallel   0
                       1
                       2        -
                       3        -
                       4        -           -
                       5        -           -
                       6        -           -
                       7        -           -
     -----------------------------------------------------------------
Does this explain the previous results?