Outline
In this lab you will:
- revise how to load a pre-trained machine learning model into p5.js
- Use the output of the model to change visual elements in your sketch
- create a series of p5.js sketches which utilizes the output of a machine learning model
Introduction
In this lab, we will be using the output of a pre-trained model to manipulate visual elements of a sketch. Exactly how you utilize the output of the model is up to you and how it affects the visual elements on your screen e.g. shapes, colour, motion and rotation, is also up to you.
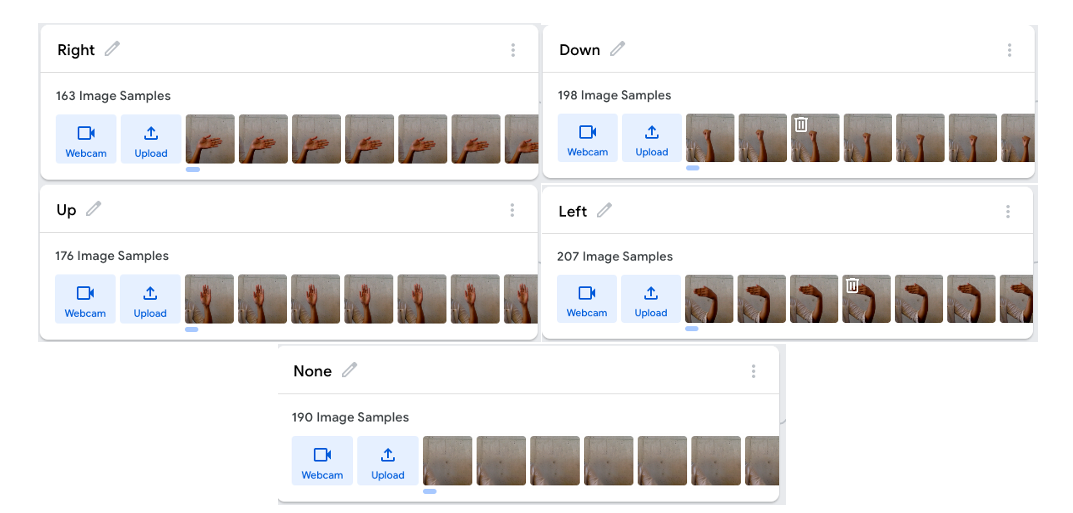
In the live coding exercise we did at the start of class, we used a model which classified hand signals. The output of this model was then used to manipulate the direction of a moving dot in your p5.js canvas. You’ll notice that the lab template repo for this week already contains the code from the live coding exercise. Your task during this lab is to modify the code in your template repo to create a custom sketch which uses the hand-signal model’s output to change some aspect of the visuals in your sketch.
If you want to train your own classifier with Teachable Machine, you’re more than welcome to do so :) If you have any trouble loading the model into your sketch, ask one of your instructors.
You have a lot of freedom in this lab to create your own interactive sketches which utilize a classifier. The only requirement we will impose is that your sketch should explore the provocation below.
Provocation
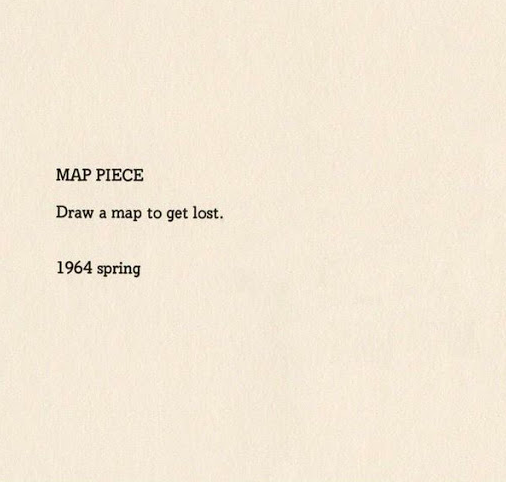
Harness the output of a pre-trained classifier to create a sketch which draws a “map to get lost in”.
We briefly introduced provocations in the labs last year, but as a refresher, a provocation is a written prompt. It “provokes” thought and can act as a focal point for idea generation in a creative activity.
The provocation which you will explore in this lab, “Draw a map to get lost”, is taken from Yoko Ono’s book titled “Grapefruit”. This book is full of conceptual art and instructions for art; which works well for us since we will be writing instructions in code. The prompt “Draw a map to get lost” also has a lot of room for interpretation, which means you and the person next to you might have completely different ideas of what a “map” is or what it means to get “lost”. Which is great because that is the idea behind the labs you will be doing every second week; we give you an open-ended provocation which you can a) explore possible interpretations of and b) generate a sketch which explores an interpretation c) create variations of your sketch.
Fork and clone the template repo for this week’s lab.
Brainstorm
If you’re not sure where to start with the provocation, it might help to pick apart the provocation and brainstorm some ideas. Here are some things to think about to get you started. Feel free to discuss your interpretations with someone sitting next to you.
Picking apart the provocation:
- What are possible interpretations of “maps”? (e.g. roadmaps, heatmaps, bitmaps, other?)
- What does it mean to “get lost”? (e.g. unable to recover, hard to follow, become immersed in something?)
- Should the “map” itself get you “lost”, or should the experience of drawing it get you “lost”?
Implement
After some brainstorming, you might already have a clear idea of what you want to implement. If you do, that’s great – happy coding! If you’ve done some brainstorming and you’re not sure where to start, you can play around with the code in your template.
Here are some things you can try:
- Currently, the model’s output changes the direction of a dot. Can you change the shape based on the model output? Or perhaps the ‘attribute’ of that shape e.g. its colour, size, rotation?
- Can you use iteration in your sketch to generate a pattern of shapes in your sketch?
- The “raw” output of the model is actually an array of Objects. Each object has a class name e.g. “Up” and a number which represents the model’s confidence in classifying the current video frame as “Up”. Can you use more than one element from the models “raw” output array in your sketch?
You may have noticed from training your own models last week that you need to make several decisions during the training process. For example, you decided which images to use in each class for the training dataset and perhaps your decisions were based on your opinion of what best represents each class. The act of training a machine learning model can introduce algorithmic bias. This is where a trained model produces systematic and repeatable outputs (predictions) which might be unfair, unfavourable or limiting. Can you extend your sketch to explore this idea of algorithmic bias?
Before you leave class today, make sure you commit and push your work to git.
Summary
Congratulations! In this lab you:
- created your own interactive sketch which uses machine learning classifiers