Background
The GDB and x86-64 assembly exercise in the second week is often hard to approach by new students of COMP2310. In this page, we will show you some ways to approach the problem and a few basic optimizations you can make. In places, we will assume you have taken the prerequisite course COMP2300 and have not forgotten everything.
Before beginning with actual content, there’s a few things to check off:
- Read through the source (jacobsthal.c) and get an idea of what it’s doing
- Compile and assemble a working executable (make assembly, make jacobsthal)
- Run the jacobsthal executable you’ve generated with some arguments and convince yourself that the output is correct
- Install an x86 syntax highlighting extension of your choice
Introduction#
Open up the assembly file, jacobsthal.s. You should have some syntax highlighting from the extension you’ve installed. Check in the bottom right of vscode that it’s in the correct highlighting mode, as sometimes it will try and use ARM highlighting.

Although the instruction set is different, this assembly should be familiar to recent COMP2300 students. There are labels, assembler directives (lines beginning with a . ), and instructions. A few key details:
- Operand order is reversed compared to ARM. The destination is the second operand - i.e. mov src dst
- x86 is a CISC ISA, and most instructions optionally operate on memory for one or more operands. Memory accesses are denoted by round brackets, eg (%rsp)
- Register names are prefixed with a %
- %rsp is the stack pointer
- %rbp is a general purpose register which the compiler may use as a stack base pointer
- %rip is the instruction pointer, or program counter
For more details on addressing modes, and x86 assembly in general, consult the week 1/2 lectures. The lab exercises are concerned with optimizing the jacobsthal function.
Reading x86-64 Assembly#
In the assembly file, locate the for loop which calls jacobsthal.

Label names may differ. You should be able to see the basic loop structure here. The compiler is storing variables on the stack, and they are being accessed with movl, using offsets from the stack base pointer.
Even without knowing the x86 calling convention, you should be able to figure out what registers are being used for what. Determine which registers are being used to pass and return arguments to jacobsthal, then check your answer below.
Solution: %edi is being used to pass the argument to jacobsthal. %eax is being used to return the argument from jacobsthal.
Before we continue, can you spot an easy optimization of the compiler-generated assembly? Check the two movl instructions before the call.
Solution: movl -8(%rbp), edi. There is no need to first place the value in eax - it will be overwritten by jacobsthal anyway.
Next, locate the jacobsthal function that is being called in main. Within jacobsthal, locate the two recursive calls. Also locate where the function is returning. There will be two instructions that mark the end of the function - leave and ret.


Unlike arm, x86 does not have the concept of a “link register”. When the call instruction is used, the return address is pushed to the stack and the CPU jumps to the target label. ret is the inverse of call - it pops the return address from the stack and jumps to it. Equivalently, in arm assembly:
push PC
b target	@call

pop PC	@ret
Note that you will need to have disposed of the stack frame of the called function in order for ret to return to the correct address. The leave instruction takes care of this. Note how the first two instructions in jacobsthal push the caller’s base pointer on to the stack, then set up the base pointer for the current stack frame. From here, you can deduce a few things:
- %rbp is a callee-save register under the calling convention in use
- %rbp contains the start of this function’s stack frame
The leave function performs the inverse of these instructions. It sets the stack pointer back to the base pointer, effectively popping all of the call frame off the stack. It then pops in to %rbp, restoring the caller’s base pointer. Before moving on, in summary:
- call pushes a return address to the stack then branches to the target
- ret pops the return address off the stack and branches to the return address
- leave cleans up the stack frame, using the base pointer, and restores the caller’s base pointer
GDB#
With some idea of how the program is executing, it’s now time to debug. A lab exercise asks you to draw a stack frame, which can be achieved by inspecting memory of the running program. Start by running the executable in gdb.

Before starting the program, there are a few steps to take. Recall in COMP2300 when debugging a program, the debugger would automatically halt at the start of the main function. This breakpoint will need to be set manually here. You will also need to set up the arguments given to your program.

Note that gdb links back to the C source file - this is achieved using the .loc assembler directives you can see throughout the assembly.
The function we’re interested in is jacobsthal, so set a breakpoint appropriately and continue execution.
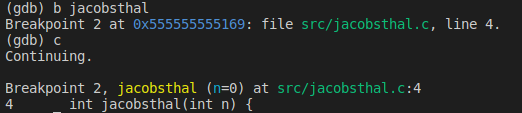
The debugger is now paused on the first line of the jacobsthal function. Run the following:
help info
This will open a help menu for the info command. You can leave this menu by typing q and enter. Find the info command for function arguments, and local variables - inspect these values and make sure they seem correct.
The info command is very powerful, but for debugging a simple program it may be faster to use the backtrace command:

You can see the stack frame of each function, its arguments, and the last executed line in the C source.
Let’s step through jacobsthal manually to get to the first recursive function call. To help keep track of where the program is up to, display the next instruction to be executed like so:

This will run x/i $rip whenever you step, examining memory in instruction format at $rip. Step through jacobsthal with si (step instruction) until you reach the next call to jacobsthal. Follow along both the C source and the assembly. Don’t forget that constants may be in decimal or hex - if the instructions don’t match in gdb and the assembly file, this is probably why.
Along the way, you can view register info with info reg. Eventually, you should get to here:

Now that the CPU has entered the next call to jacobsthal, it might be a good time to check out memory and look at the stack frame so far.

The backtrace shows that we’re now in a second nested call to jacobsthal. Using examine(x), we can see the top two words on the stack are the return address to the first call of jacobsthal. This address was placed on the stack by the call instruction. Note the use of a 2-word examine; as the computer you are working on is almost certainly a 64 bit machine, we need two words, or 64 bits, to fit the entire return address.
Let’s view the stack frame of the first jacobsthal call so far. The base pointer has not yet been modified, so it can be checked to know where the stack frame begins.

We also know where it ends, as there is only one other thing on the stack right now - the return address for the second call. Thus, the stack frame is from 0x7ffffffffdc78 to 0x7fffffffdc50.

The above image should provide most of the necessary info to sketch a stack frame of the jacobsthal function. You can identify the start of both jacobsthal stack frames by locating the return address on the stack. For the first call, you can also identify the preserved base pointer of main(0x7ffffffffdca0) and one of the local variables (0x00000004). From the backtrace, you can also see local variable values. Using their values, locate them within the stack frame. Check your answer below.
In this example, n_minus_one is located at 0x7ffffffffdc68, and n_minus_two is located at 0x7ffffffffdc6c. The exact memory address in use for result is slightly more tricky to determine - from the assembly, you can see it is stored after the other two variables - thus it will reside at 0x7ffffffffdc64.
To view just the stack frame of the first jacobsthal call, you can use examine like so:

Viewing the stack frame may be simpler if all of the variables have been calculated to their final values, rather than left uninitialized. Let’s continue until just before the very first jacobsthal function returns to main. You can set a breakpoint at a memory address, like so:

Other useful commands for manipulating breakpoints include:
disable n
enable n
delete n
info b
Where n is the number of the breakpoint. Run through your program, investigating the bracktrace and stack contents as you go, until you reach the return of the outer-most jacobsthal call.

Sample backtrace at maximum recursion depth.

Stack frame of outer-most jacobsthal return, just before leave/ret. Note the now-populated local variables instead of uninitialized data, and variable containing return value(5).
Conclusion#
Hopefully you have some ideas about using gdb by now and may be able to complete the first few exercises in lab 2. We haven’t talked much about the optimization challenge, however from going through the code in the debugger and seeing how it uses the stack we are sure you can spot some quite easy ones straight away.
Throughout the post we avoided mentioning the calling convention beyond what was immediately obvious in the assembly. Calling conventions differ by OS. The examples in this exercise were done on a computer running Linux, similar to the lab machines. Some research about the calling convention that’s in use, and which registers need to be saved by who, may be helpful for optimizing the assembly.