Outline
- learn how to use for-loops to introduce repetition
- write your own for-loops in various contexts
Introduction
Another week, another creative code class :) This week we will be exploring repetition. No time to waste! Let’s make a start on the first activity.
Fork and clone the Lab 6 template repo.
Part 1: for loops
Below is the for loop we wrote during the live coding session. As you might have started to realize, p5.js can be a bit picky about exactly how you write your code. Each time you write an if-statement, you have to start with the word if. If you don’t, p5.js complains; it throws errors, we throw hands.
For-loops are no exception. There are some parts of the syntax in a for-loop which you have to write the same way each time you write a for-loop. There are other parts of the for-loop which you can/should modify to the specific programming task you’re working on.
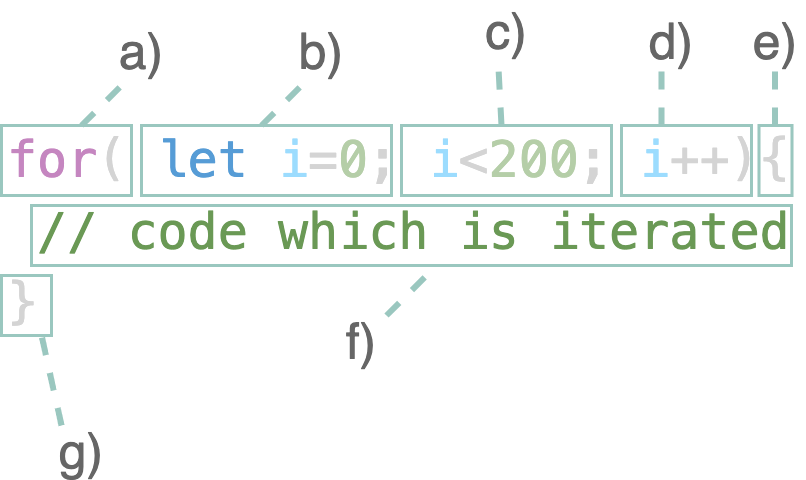
do: Q1 The diagram above shows a deconstructed for-loop with certain sections labeled a), b) and so on. For each section in the diagram, write down whether 1) you need to write it the same way each time you write a for-loop, or whether you can modify it, 2) in your own words, describe the purpose of each section, 3) if you can modify the section, state whether there are any restrictions on the types of modifications you can make (i.e. can you replace that section with any code you like?). Write your answer in the exercises.md file in your template repo.
Part 2: drawing rows of circles
Circle position by index
In this section, we are going to recreate the sketch below using for-loops. You’ll notice that each circle has been labelled with an index. The first is labelled 0. This is a convention in computing – we usually start indexing from zero.
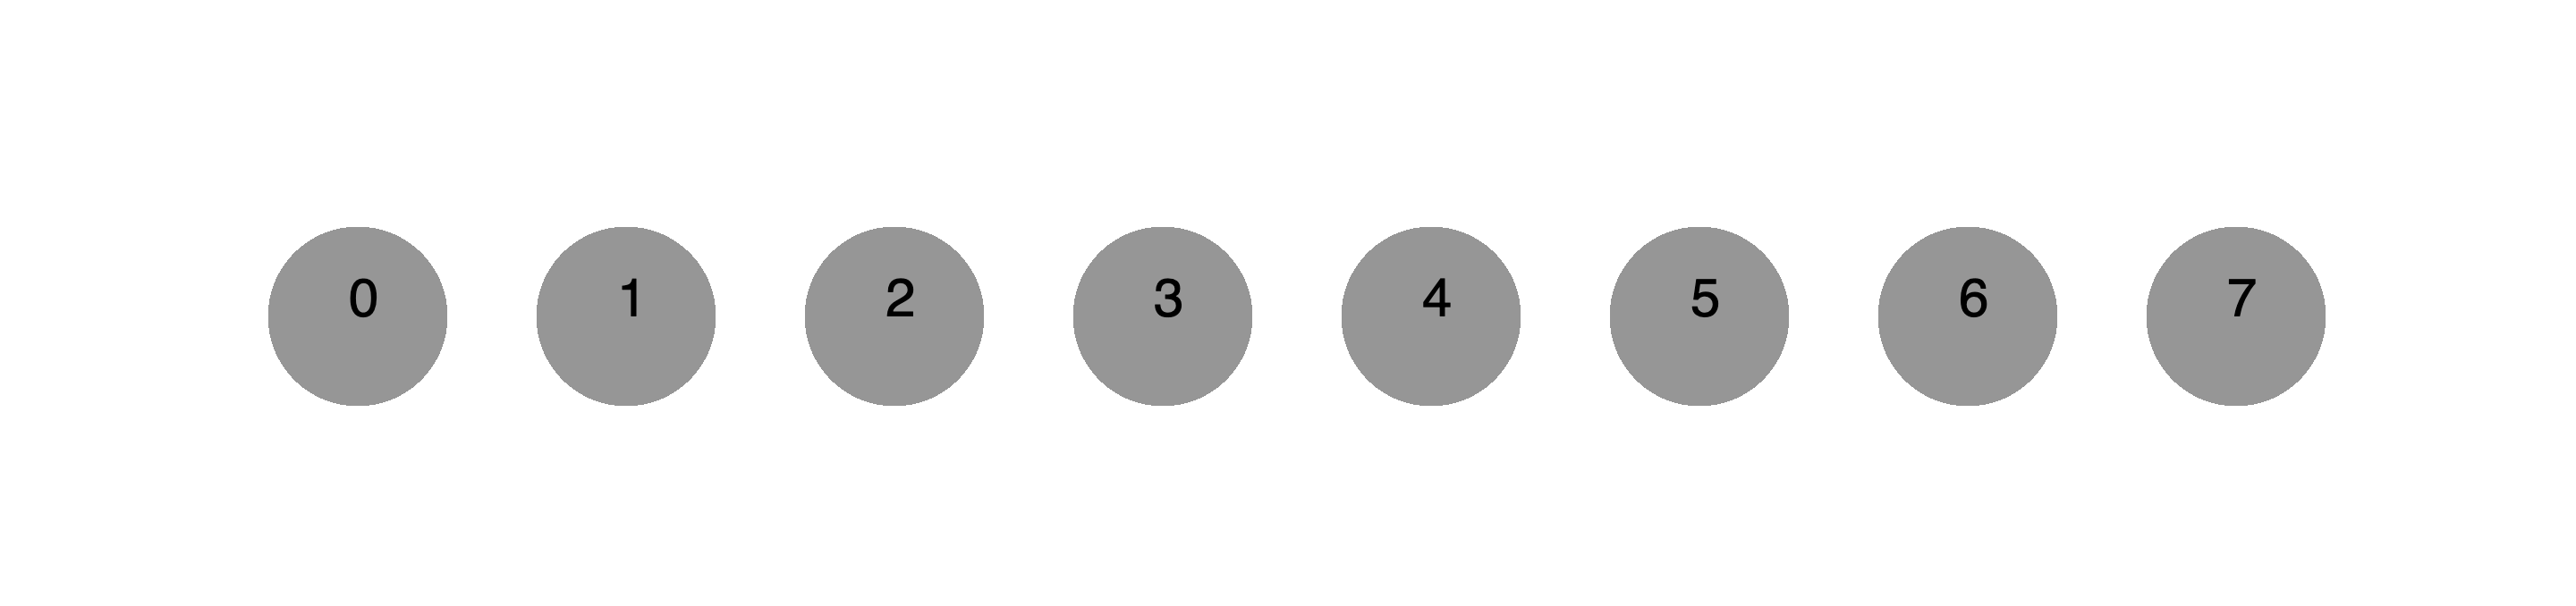
Let’s assume the variable i represents the index of any circle. Your task in this activity is to come up with a general rule which determines the position of a circle, based on its index. We will do this just with pen and paper first and will move on to writing code in the next section.
talk: Q2 With the person next to you, discuss how you can write a mathematical expression in terms of i which determines the x-position of a given circle from the sketch above. You are encouraged to use a pen and paper to help you :) Write down your expression in the exercises.md. If you need some help, ask one of your instructors.
Using a for-loop
Now it’s time to start coding. To help you out a bit, we’ve written a for-loop for you. Unfortunately, it doesn’t quite do what we expect it to: it doesn’t generate anything that looks like the row of circles above.
for(let i=0; i<200; i++){
    circle(60, 100, 60)
}
do: Q3 Copy and paste the code above into your template repo and open your live server. In your own words, describe what the for-loop above is doing. Describe which aspects of the for-loop you will need to modify to correctly draw a row of circles. Write your answer in the exercises.md file.
Now let’s modify the sketch to draw a row of circles.
do: In your template repo, write a for-loop which draws a row of six circles like the sketch above. You will have already come up with an expression which relates a circle’s index to its position–this might come in handy. Once you’ve finished, make sure you commit and push your code to git.
Part 3: circle gradient
Here we have another row of circles, but it’s intensity is decreasing as we move from the left to the right.
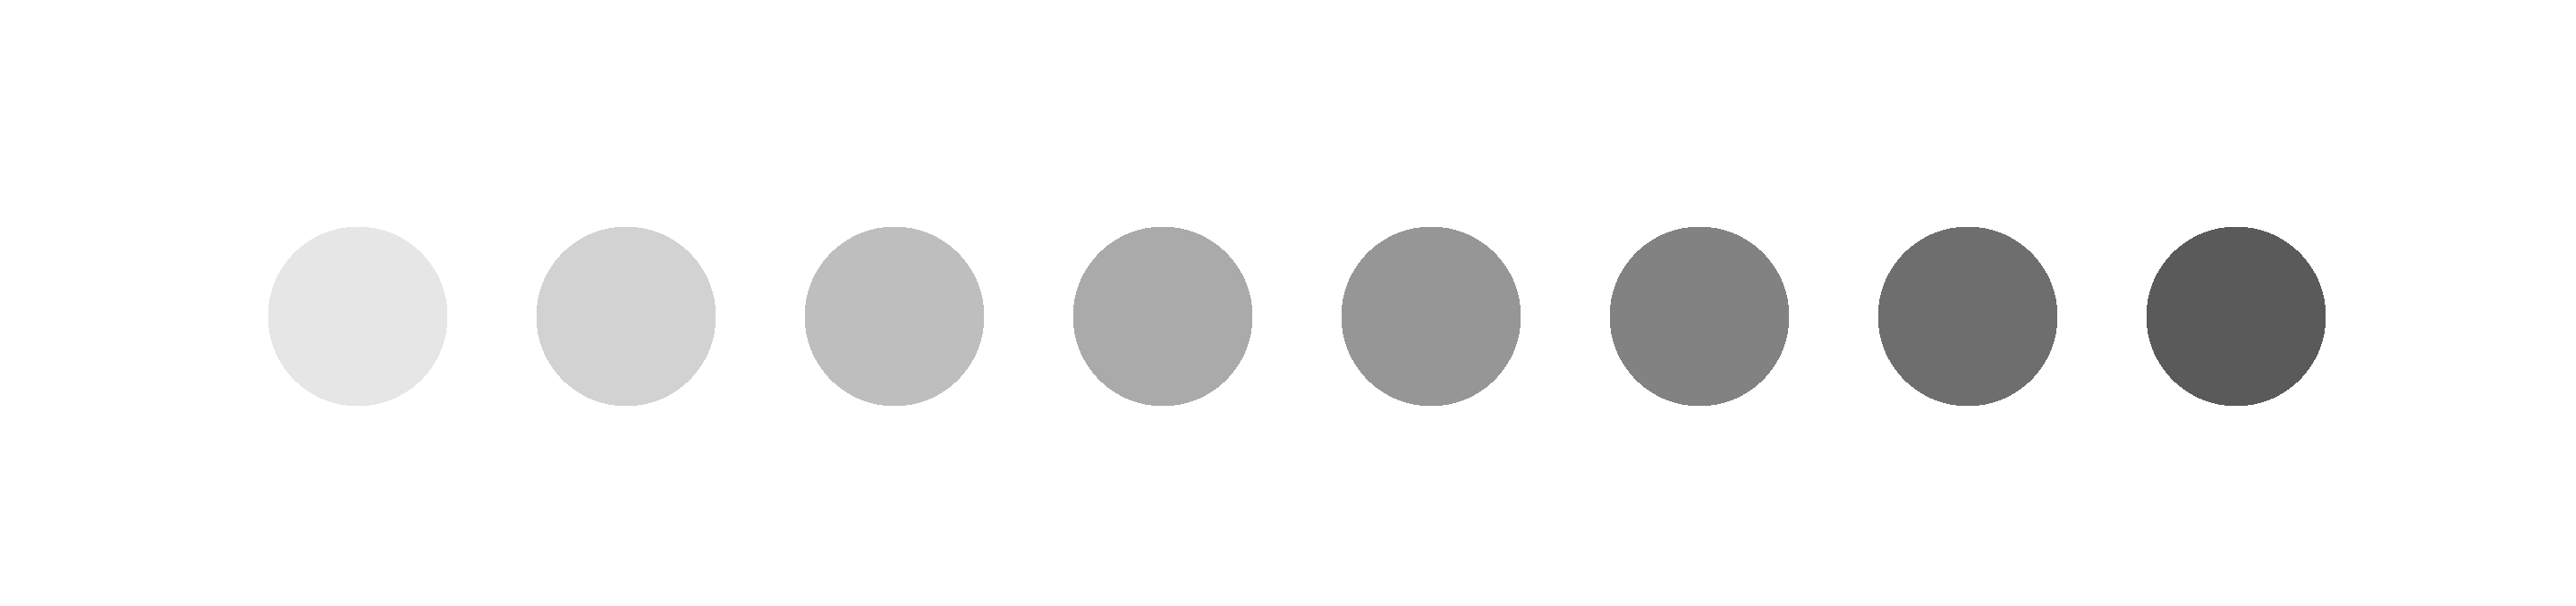
do: Modify the for-loop you created from Part 2 so that the intensity of your circles’ colour reduces towards the right. Make sure you commit and push your work to git.
Part 4: varying heights
The sketch below shows a set of contiguous (meaning touching), rectangular columns with varying heights.
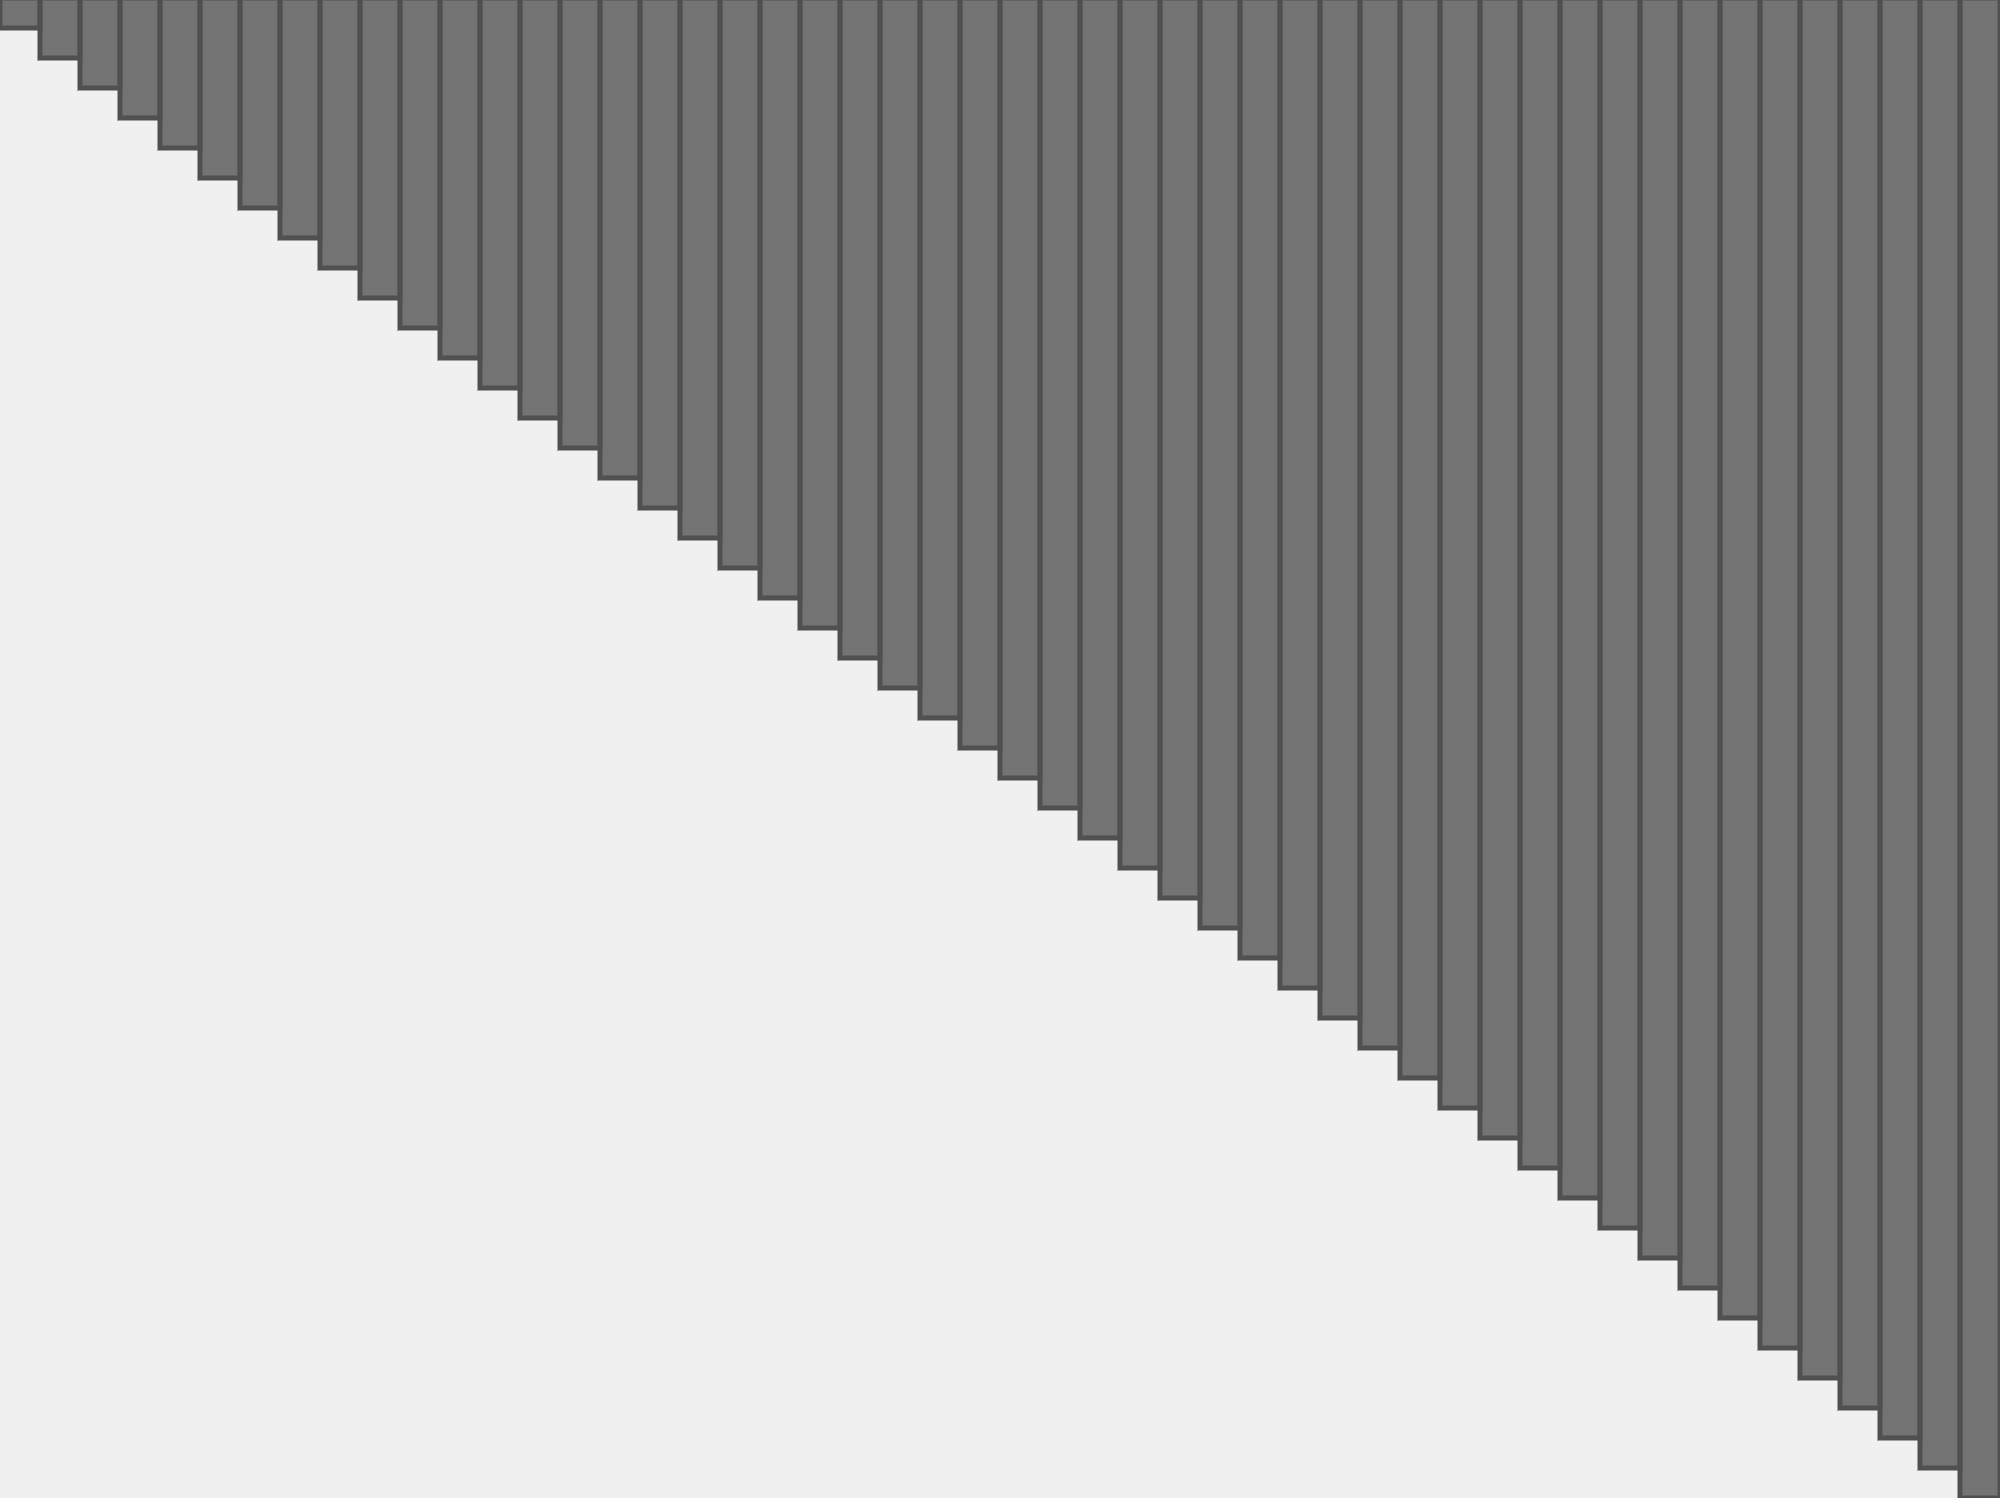
do: Recreate the sketch above. Remember that the heights of each bar increases towards the right. Make sure you commit and push your work to git when you’ve finished. If you need some help, ask one of your instructors.
Modify your code to create the sketch below. You should already have some code which creates the dark grey bars, we just need to add the light grey bars. Notice that there are more light grey bars than there are dark grey bars.
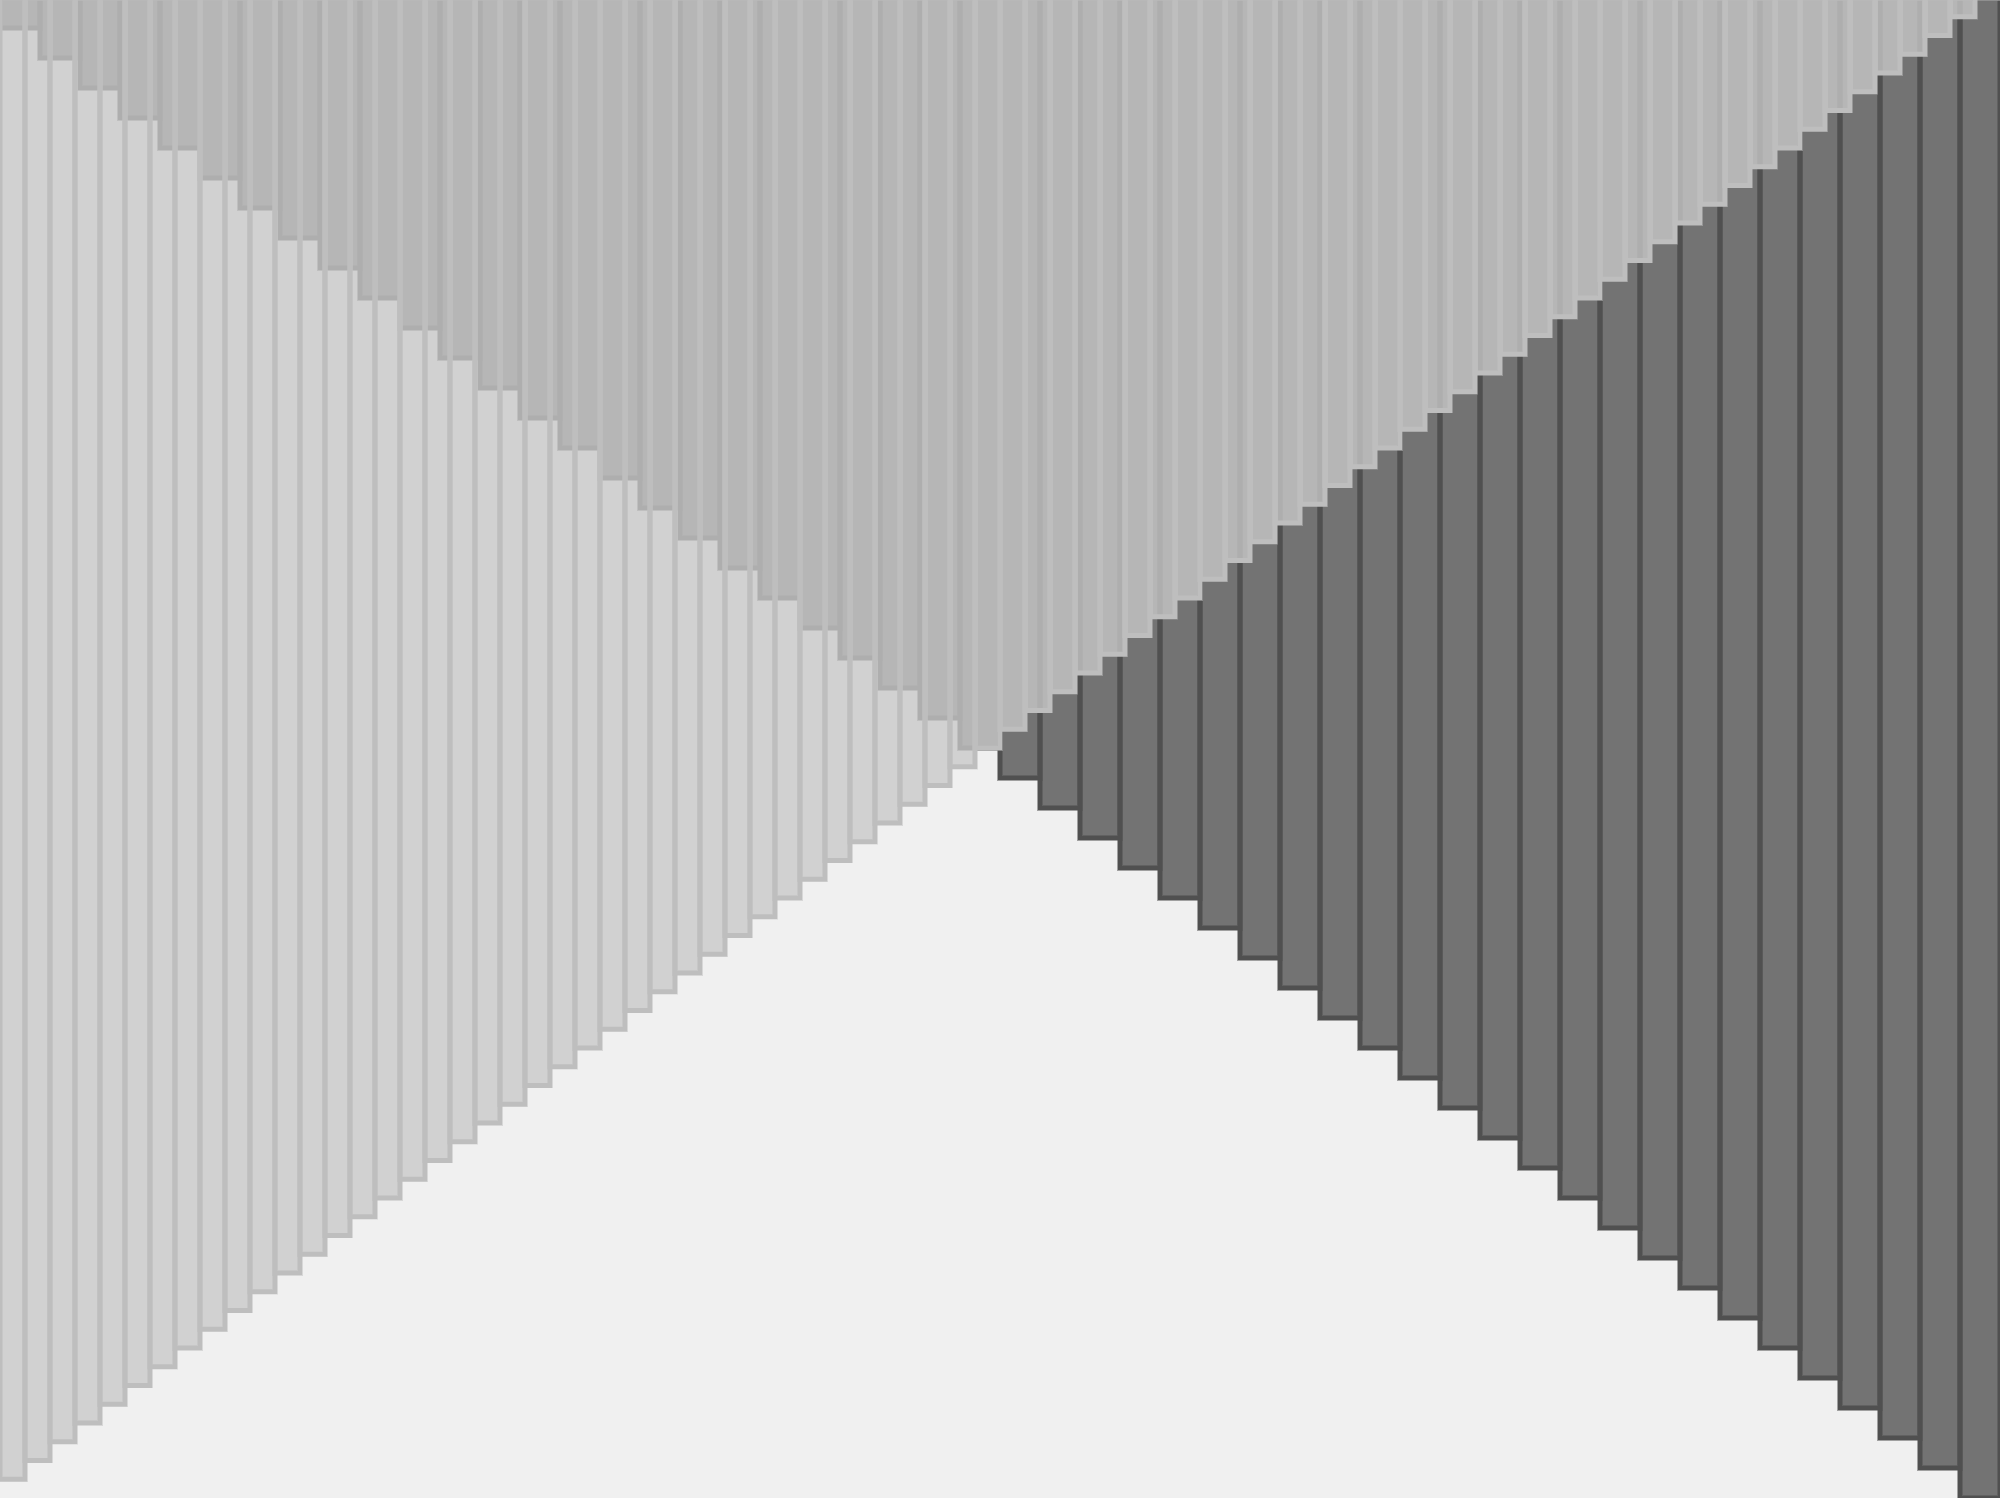
do: Recreate the sketch above. Make sure you commit and push your work to git when you’ve finished. If you need some help, ask one of your instructors :)
Part 3: radial columns
Our columns have now lost all sense of camaraderie and have dispersed in a radial fashion (see the sketch below).
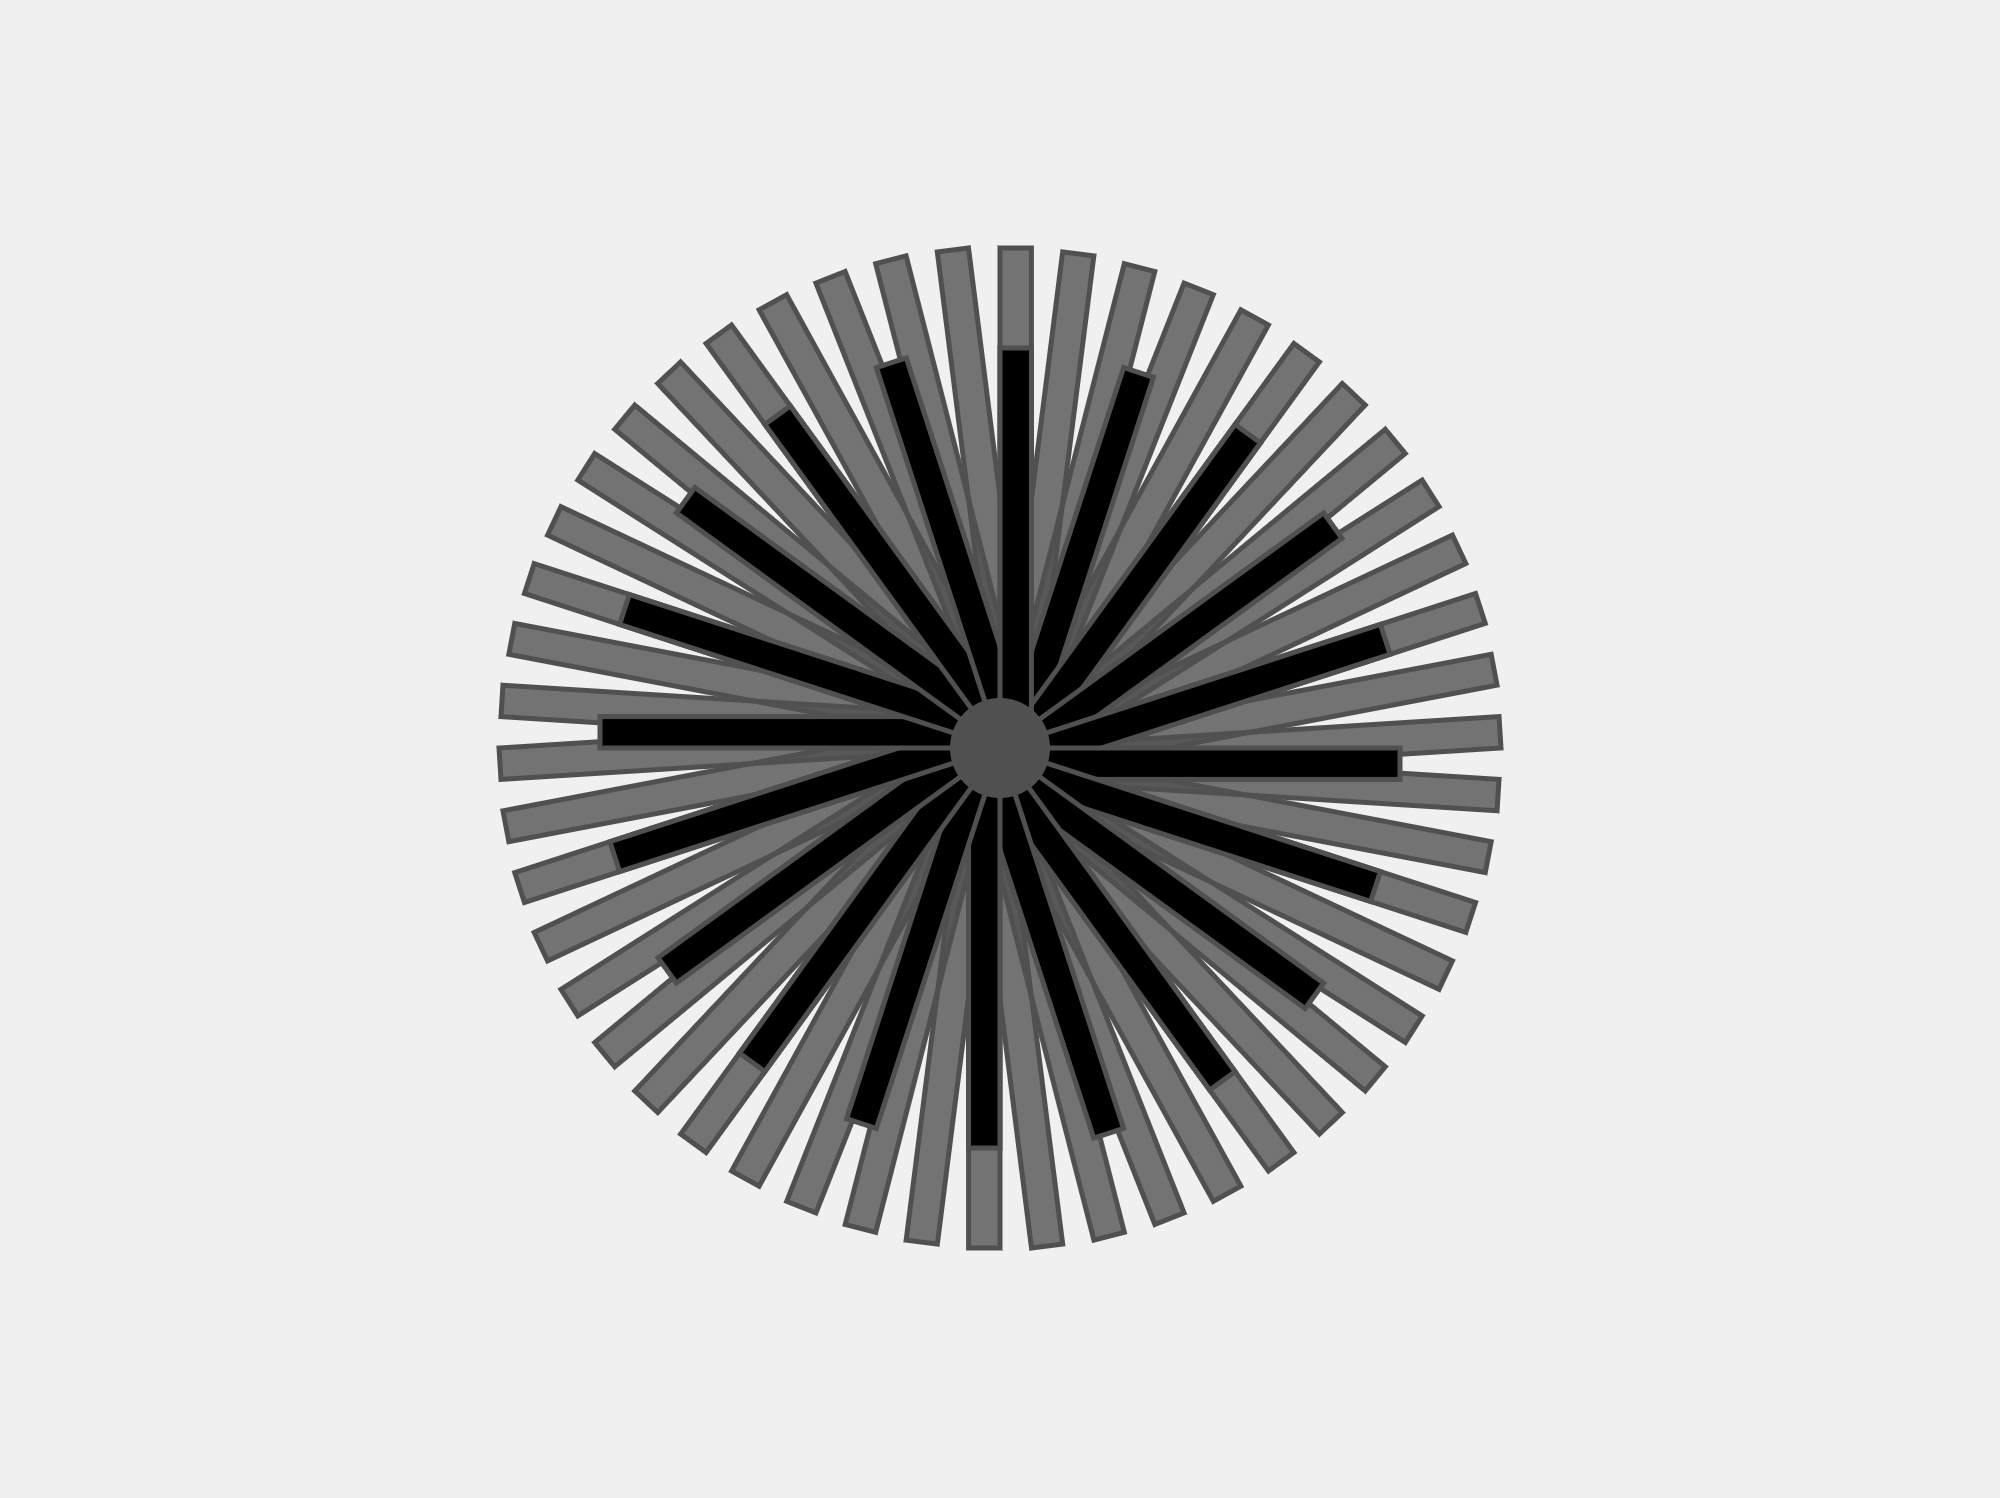
do: Recreate the sketch above. Make sure you commit and push your work to git when you’ve finished. Again, pen and paper can be your friend here :)
Notes: rotating a rectangle around a point is shown in this example. HOWEVER - if you try this in a for loop
you will combine transformations as you progress through the loop - creating unexpected behaviours. You will have to use resetMatrix() (ref here) to reset transformations back to “no transformations” as the first thing in your for-loop.
Part 3: variation
Now, let’s go back to the familiar ‘row of circles’ sketch. The for-loop below will draw a row of six circles. Replace any code you currently have inside your draw() loop with the code below.
background(210)
noStroke()
fill(50)
for(let i = 0; i < 6; i++){
    circle(i*60+30,100,50)
}
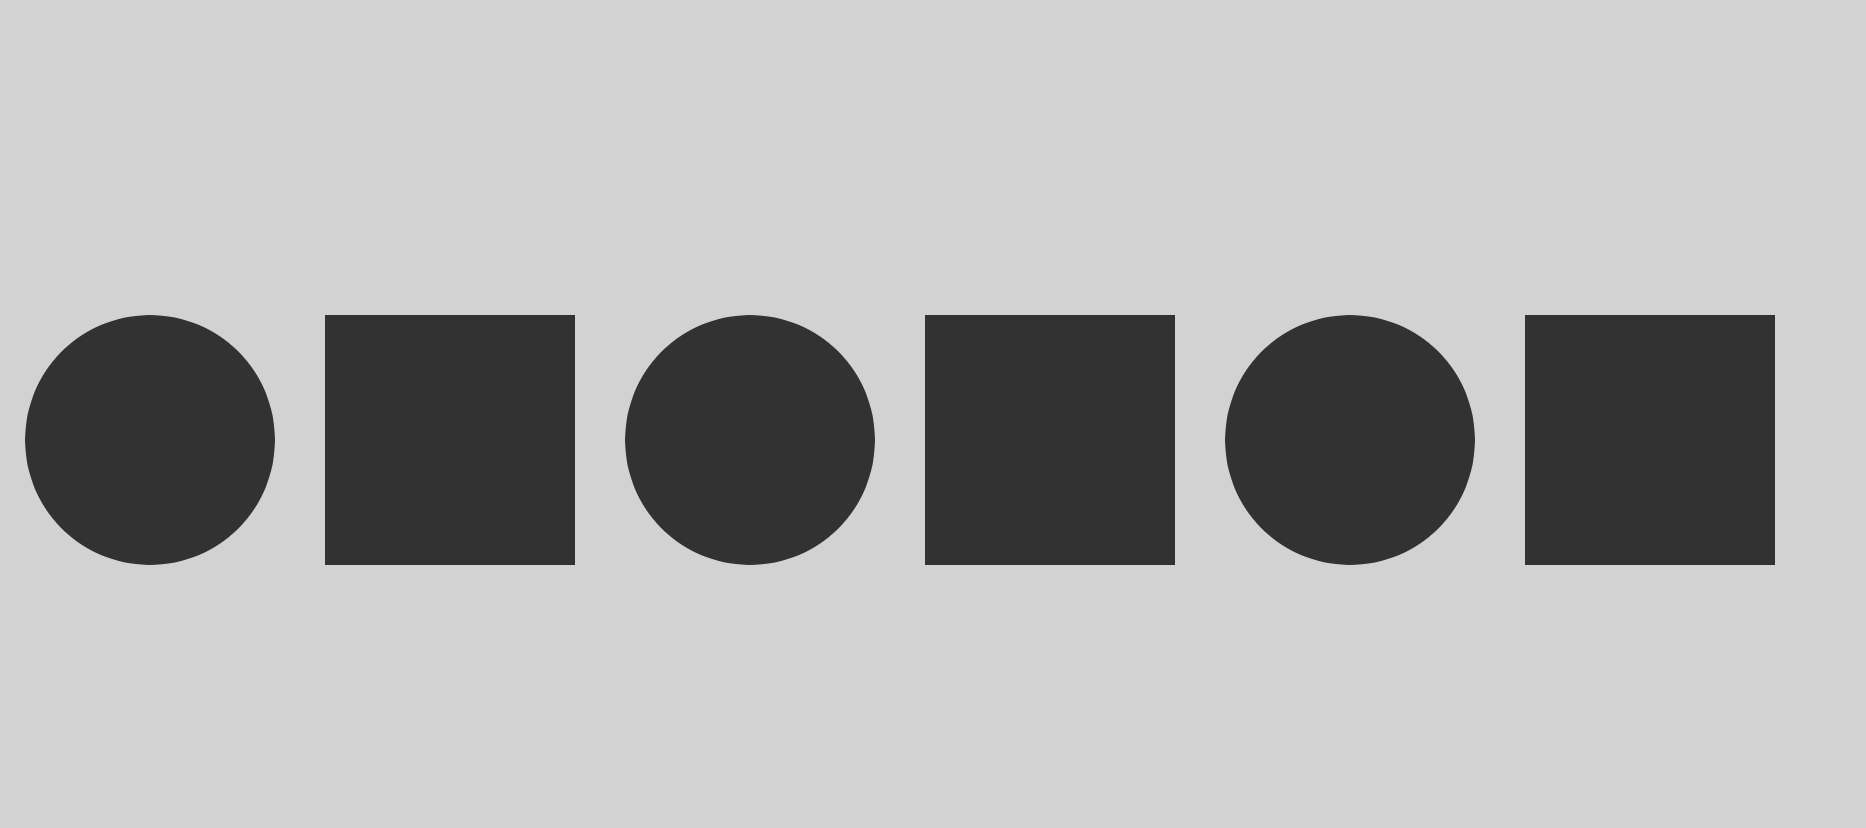
do: Modify the code above so that every other circle becomes a square (see image above). Make sure you commit and push your work to git when you’ve finished. If you need help, ask one of your instructors.
Part 4: Grids
It’s time to take our row of circles and create a grid of circles. You’ll remember that the x-position was determined by an expression like i*40+10 where i represents the index of the circle. When using this expression in a for-loop, the loop automatically increments the value of i with each iteration of the for-loop. So when i=0, the 0th circle is drawn, when i=1, the 1st circle is drawn… and so on.
Suppose we want to draw a 6X6 grid of circles. A 6x6 grid can be represented as six rows of six circles. The first row in our grid will have circles with index 0, 1,…,5, the second row in our grid will also circles with index 0, 1,…,5 and so on. This is a convenient way of approaching grids because, well, we already know how to draw a row of circles.
When we were drawing just a single row of circles, we only needed one index; we called it i. Now that we are drawing a grid, we need another index to keep track of which row we are drawing. We can call this index j.
In the image below, you’ll see each circle is labelled with two numbers; something like 0,4. The first number is the i index; this tells you which circle we are drawing in the current row. The second number is the j index; this tells you which row we are currently in.
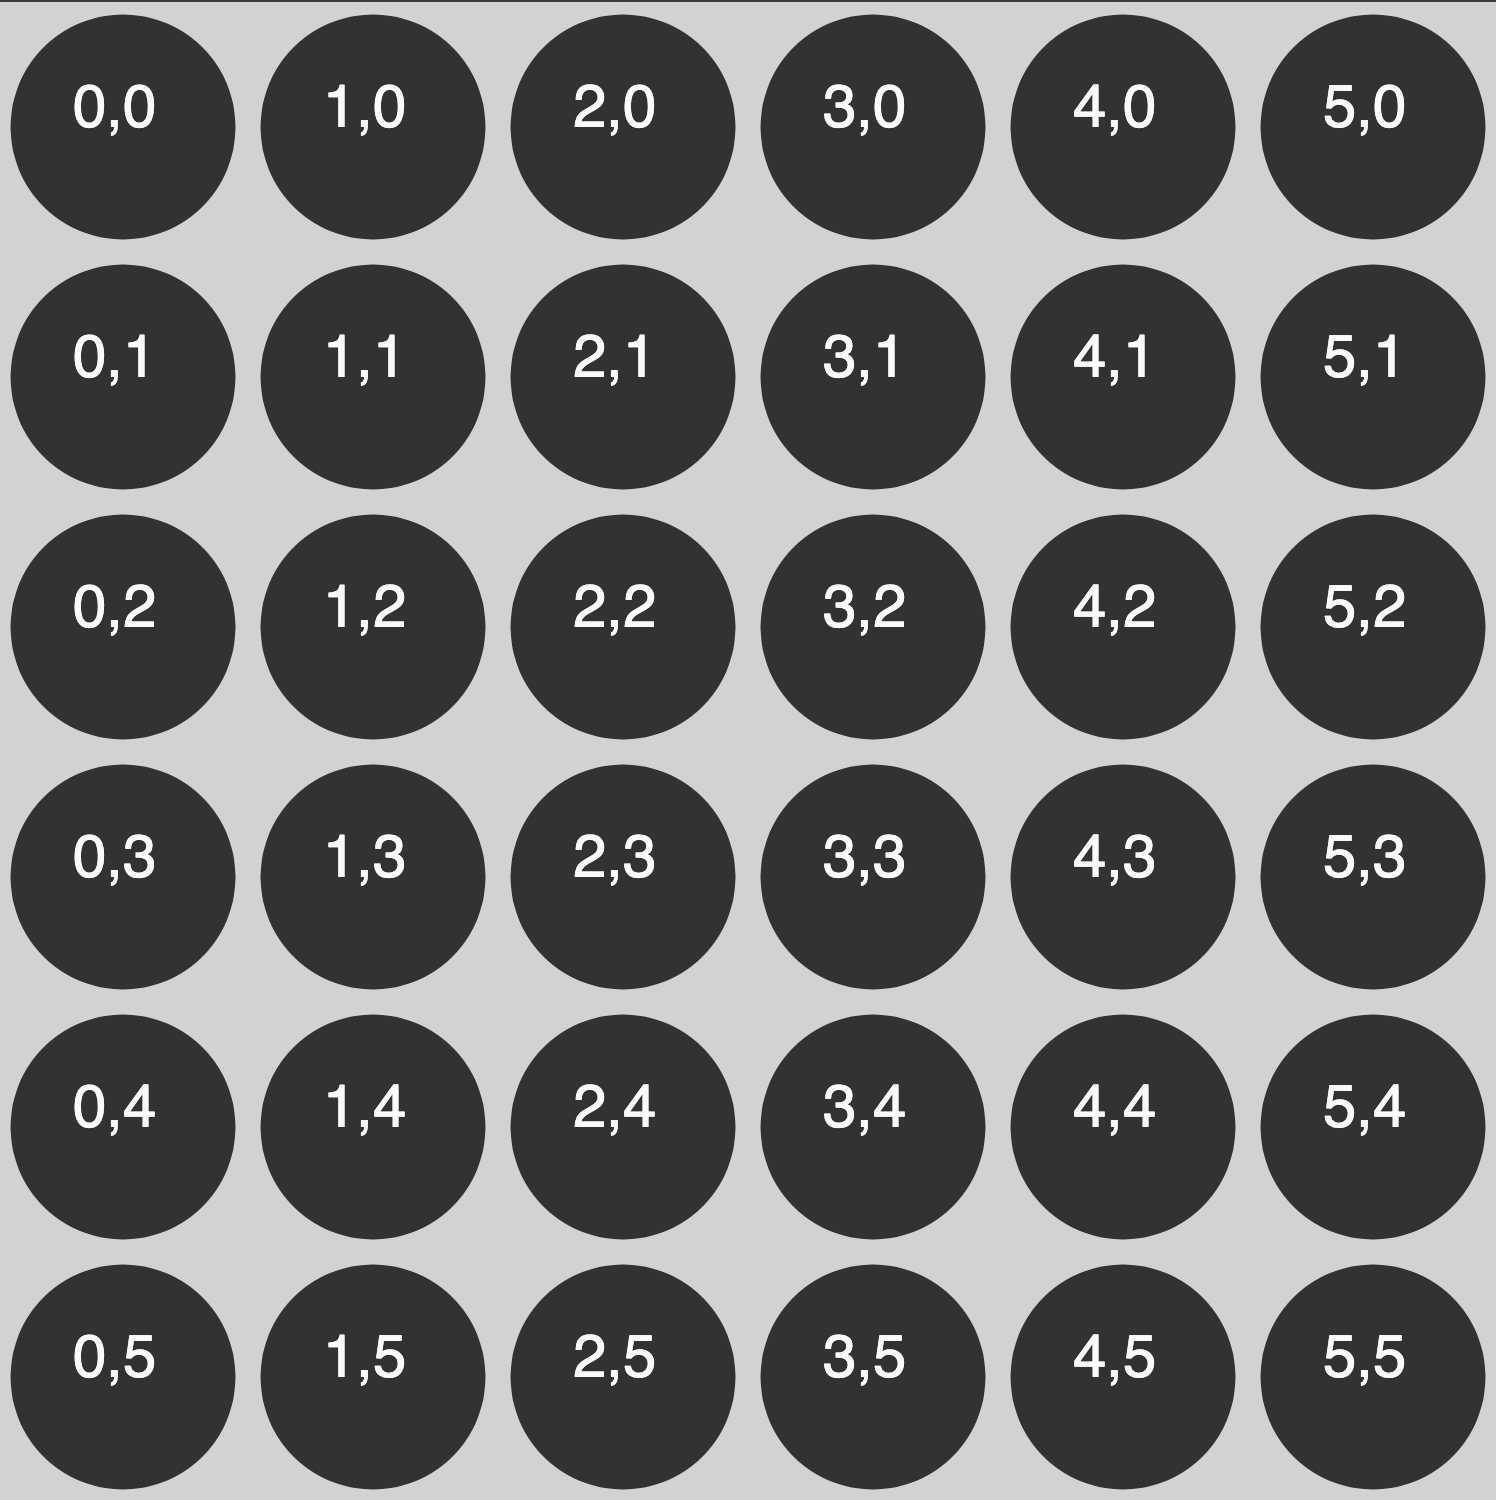
talk: Call over an instructor and discuss with them what you would need to do to draw a grid of circles like the sketch above (using your knowledge of how for-loops work). After a bit of discussion, your instructors will ask you to write your approach in your exercises.md file.
do: Once you’ve discussed things with an instructor, start coding up your solution. Make sure you commit and push your work to git when you’ve finished.
extension: 1) introduce some random variation across your grid, 2) create a kaleidoscope, 3) create a dynamic grid which changes over time. Make sure you commit and push your work to git when you’ve finished.
Summary
Congratulations! In this lab you:
- Learned how to use for-loops
- Wrote your own for-loops in various contexts
- Potentially revised conditional statements