Project Assignment 2017
When talking about weather, expressions like “a one in a hundred year event” are often used. But how does one decide what should happen only once in a hundred years? In this assignment, you will implement different methods to answer this question, and apply them to rainfall data provided by the Bureau of Meteorology.
Practical information#
The assignment is due on Thursday the 19th of October at 5pm (three weeks after it is released). Like all other due dates, this deadline is hard: late submissions will NOT be accepted.
For this assignment, you may work in groups of up to three students. Working in larger groups (more than three students) is not allowed. If we find that four or more students have been working together, all students involved will be reported for plagiarism.
A group sign-up activity is provided on wattle. If you intend to work in a group, you and your team mates should find an unused group and add yourselves to it. (The group numbers have no meaning; we only care about which students are in the same group.)
Working in a group is not required. If you want to do the assignment on your own, please add yourself to the “I will do the assignment on my own” group, so that we can keep track.
There are two submission components:
- Each group must submit their code (one or more python files) and user documentation (a text file with instructions for using the program). Only one person per group needs to submit this.
- Every student must submit an individual report, with answers to a set of questions. Details about the format of the report and the questions are in the section titled “Individual report” below.
Problem description#
It is important that you understand what is the problem you are asked to solve. An assignment submission that solves the wrong problem will not receive good marks, no matter how well it is written. If you have questions about the assignment problem you should ask via the discussion forum on wattle, or talk to your tutor. Just remember that posting solutions (or parts of solutions, or drafts of solutions) to assignment problems not allowed.
(Time-)Series data and quantiles#
Abstractly, the problem we consider can be described as follows: We are given a sequence of n data points, X = x0, x1, .., xn-1, which we assume to be a representative sample of some (stochastic) process, and a frequency threshold F. We want to determine a value xF such that values equal to xF or greater appear in the sequence no more often than, on average, at every F:th position in the series. Here are two ways we can define this threshold value:
Method (a) Find the smallest value xF in X such that for any two values xi and xj in X, if i =/= j, xi >= xF and xj >= xF then abs(j - i) >= F. In other words, any two distinct indices where the values are greater than or equal to xF are at least F steps apart.
Method (b) Find the smallest value xF in X such that no more than n / F values in X are greater than or equal to xF. In other words, xF is the (n / F):th largest value in the series.
The value computed by method (b) is the top 1/F quantile of the data. If the sequence is sampled from a stationary random process, we expect to see values at or above the 1/F quantile on average every F:th sample.
The two methods of calculating the threshold value xF will often give different results.
Both methods above are defined as identifying exceptionally (once every F) high values in the series. We can of course also find the threshold for exceptionally (once every F) low values in an analogous way, by reversing the inequality.
Weather data#
The Australian Bureau of Meteorology provides access to some of their weather observations, including some historical observations (as far as their records go back). Here are some example files:
-
Rainfall_Sydney_066062.csv: Daily total rainfall at Observatory Hill in Sydney (station number 066062), since the middle of 1858.
-
Rainfall_Canberra_070247.csv: Daily total rainfall at the National Botanic Gardens, Canberra (station number 070247), since late 1968.
-
Rainfall_Queanbeyan_070072.csv: Daily total rainfall at Queanbeyan bowling club (station number 070072), since late of 1870, but only to 2015. (This seems to be the longest-running measurement series taken in a single location near Canberra.)
The data files are in comma-separated value (CSV) format.
They are text files, where each line, except the first, corresponds to
one (daily) observation.
Each line has eight fields, which are separated by a comma (',').
The first line is a header, which has headings for each of the fields.
The fields are as follows:
| Column | Explanation |
| 0 | Product code (This is a string that identifies the type of data.) |
| 1 | Station number |
| 2 | Date of observation: Year |
| 3 | Date of observation: Month |
| 4 | Date of observation: Day |
| 5 | Observation data This is the total rainfaill, in millimetres. Usually it is measured over a single day, but sometimes it is the total measured over several days; see next column. |
| 6 | Number of days over which data was recorded. See detailed explanation below. |
| 7 | Quality assurance. This is either 'Y' (indicating that the data has been quality checked), or 'N' (if it has not). |
Note that entries are sometimes incomplete: in particular, the data, number of days, and quality assurance fields are may be missing. Incomplete entires must be ignored when reading the file.
Clarification: If the data field is not blank, but the “number of days field” is, then this is a single-day observation.
However, you can rely on the date always being present. Also, the dates are always in increasing order, with no date repeated. Data that has not been quality assured is not necessarily wrong; in fact, you should assume it’s correct.
Observations are not always made daily. Sometimes, there is no observation for some days, followed by one entry where the “number of days” field is greater than one. Here is an example from the Canberra rainfall data:
| Year | Month | Day | Data | #days |
| 1971 | 12 | 01 | ||
| 1971 | 12 | 02 | 13.2 | 2 |
| 1971 | 12 | 03 | ||
| 1971 | 12 | 04 | ||
| 1971 | 12 | 05 | ||
| 1971 | 12 | 06 | ||
| 1971 | 12 | 07 | 2.5 | 5 |
| 1971 | 12 | 08 | 6.1 | 1 |
| 1971 | 12 | 09 | 10.4 | 1 |
This means that on the 2nd of December, a total rainfall of 13.2mm was recorded for the last two days, i.e., the 1st and the 2nd; then, on the 7th a total of 2.5mm was recorded for the five days from the 3rd to the 7th; and so on.
Rainfall data from other weather stations (in this format) is available from this page.
Aggregating observations#
The weather data files have daily observations. From this, we can calculate aggregate time series, such as “total monthly rainfall”. Specifically, we can calculate:
- The total for each month. This gives a series of monthly values.
- The total for a specific month of the year. This gives a series of yearly values.
- The total for each year. This gives a series of yearly values.
When computing the total for a month or year, it is important to check that data for the time period is complete - that is, that there is an observation for every day of the month or year. In cases where we only have observations of the total rainfall over a number of days, we can still determine a monthly total if the observation intervals align with the beginning and end of the month, i.e., if there is no multi-day observation that spans more than one month. For example, the data shown for December 1971 in Canberra above allows us to determine the total rainfall over the first 9 days of the month, even though we do not know exactly how much fell on each day.
On the other hand, to obtain a series of daily observations we have to use only those observations that are taken on a single day.
Task#
Write a program that reads in a data file in the format described above, calculates a time series (daily, monthly, or for a specific month of the year), and calculates the threshold value xF for “once in F” using both methods (a) and (b) described above.
The user of the program should be able to:
- provide the path to the file to be read;
- select the type of time series aggregation;
- select whether to compute a threshold for exceptionally high or low values;
- and specify the frequency F.
The program should output the computed threshold values (clearly showing which was calculated according to which method) and the dates (or months, or years) at which the data equals or exceeds it.
Using your program, a user should be able to obtain answers to questions such as:
-
How much is a once in 20 years rainfall for the month of June, at each of the three stations listed above, and on which years did this occur?
-
What is the once in a 1000 days amount of rain in a single day, for each of the three stations above, and on which dates did this happen?
-
What is the a once in 20 years driest (least rain) year in Queanbeyan, and in which years did this occur?
Example
As an example, here is how we would find the answer to the first question for the Canberra (botanical gardens) station: First, we read the data file, sum up the total for each month, and select only the entries for the month of June (where those are complete). This gives us the following time series:
| June 1968 | 28.70mm |
| June 1969 | 56.00mm |
| June 1970 | 26.70mm |
| June 1971 | 5.40mm |
| June 1972 | 11.80mm |
| June 1973 | 47.00mm |
| June 1974 | 24.40mm |
| June 1975 | 70.70mm |
| June 1976 | 11.10mm |
| June 1977 | 36.80mm |
| June 1978 | 43.20mm |
| June 1979 | 5.60mm |
| June 1980 | 46.60mm |
| June 1981 | 136.20mm |
| June 1982 | 14.00mm |
| June 1983 | 44.00mm |
| June 1984 | 6.60mm |
| June 1985 | 37.20mm |
| June 1986 | 7.90mm |
| June 1987 | 33.20mm |
| June 1988 | 62.00mm |
| June 1989 | 35.20mm |
| June 1990 | 14.80mm |
| June 1991 | 143.80mm |
| June 1992 | 20.60mm |
| June 1993 | 33.40mm |
| June 1994 | 36.30mm |
| June 1995 | 52.80mm |
| June 1996 | 52.00mm |
| June 1997 | 115.60mm |
| June 1998 | 135.00mm |
| June 1999 | 46.00mm |
| June 2000 | 29.00mm |
| June 2001 | 42.00mm |
| June 2002 | 49.70mm |
| June 2003 | 47.80mm |
| June 2004 | 20.40mm |
| June 2005 | 93.60mm |
| June 2006 | 73.80mm |
| June 2007 | 74.60mm |
| June 2008 | 31.40mm |
| June 2009 | 37.30mm |
| June 2010 | 29.60mm |
| June 2011 | 10.80mm |
| June 2012 | 48.70mm |
| June 2013 | 89.20mm |
| June 2014 | 73.20mm |
| June 2015 | 72.20mm |
| June 2016 | 148.30mm |
| June 2017 | 0.40mm |
Let’s start with the simpler method, (b): There are 50 entries in the series, so the once-in-20-years threshold is the 50*(1/20)th highest value. Rounding the fraction down, that’s the 2nd highest value in the series, which is 143.8. The two years in which the June rainfall equals or exceeds this threshold are 1991 and 2016. This is illustrated in the following graph:

The dashed line is the threshold; we can see that only two bars reach it.
Method (a) is trickier, and it’s for you to figure out how to compute the threshold value following its definition. In this particular example, it gives the same threshold (143.8mm). We can see from the graph that the two peaks that reach this value are more than 20 years apart, and also that if we lower the threshold to the next smaller value (from 1981) there would be two peaks less than 20 years apart. If we were to choose a more frequent interval, such as once every 10 years, the two methods would give different thresholds.
Plotting the data#
Generating graphs like the one above is not a required part of the
assignment, but it is a useful tool for validating and debugging your
code. The graph above was drawn using matplotlib as follows:
import numpy as np
import matplotlib.pyplot as mpl
years = [1968, 1969, ..., 2016, 217] # list of years in the table above
y = [28.7, 56.0, ..., 148.3, 0.4] # corresponding list of total rainfall values
x = np.arange(0, len(y))
mpl.bar(x + 0.25, y, 0.5, color='blue')
mpl.plot([0, len(y) + 1], [143.8, 143.8], '--k')  # the threshold line
mpl.xticks(x + 0.5, years, rotation=90)
mpl.show()
A different plot, using only points instead of vertical bars for each data point, can be done as follows:
# years, x and y as above
mpl.plot(x, y, '.b', markersize=5)
mpl.plot([0, len(y) + 1], [143.8, 143.8], '--k')
mpl.xticks(x, years, rotation=90)
mpl.show()
Submission requirements#
Code and documentation#
Each group must submit their code (one or more python files) and user documentation. The user documentation must be a text file named README.txt, and it should contain detailed descriptions of:
- How to use the program.
- Which file to run?
- How to provide the necessary inputs (file path, aggregation, etc), if this is not obvious from the outputs of the program.
- What the program can do and how to read/interpret the output of the program (if this is not absolutely obvious from the output).
Only one person per group needs to submit the code and user documentation. If more than one person from the same group submits code and documentation, it should be identical (if it’s not, we will decide which one we mark as the group’s submission).
Individual report#
In addition to the group submission, every student must submit an individual report with answers to the following questions:
-
Who were in your group?
You MUST provide the name and ANU id of every person in the group that you worked in.
If you worked alone, write that in response to this question.
-
What parts of the group’s submission (code and documentation) did you write?
If you worked alone, skip this question.
-
Use your program to answer the first example question above (What is the once in 20 years rainfall for the month of June, and in which years did it happen?) for the Sydney and Queanbeyan stations. Write down the answer.
-
What is the functional decomposition of your program, at a high level of abstraction? What are the main functions in the program and what is each of them responsible for? What are their inputs and outputs?
-
Select one part of the code that you have written (e.g., a function) and describe another way it could have been implemented, and why you designed or implemented it the way you did.
OR
-
Describe how the user provides inputs to the program, another way this could have been done, why you choose that way of user interaction.
You should only answer one of 5 or 6. You can choose which one.
The report should be no more than 1 page, or around 600 words. It may be a plain text file, or a PDF document.
Reports, in particular the answers to questions 4 and 5 MUST be written individually. This means that even if you are working in a group, you must write your own description of the program developed by the group. If we find that any part of the report has been copied between students in a group, all students involved will be reported for plagiarism.
Submission link#
The assignment is submitted through wattle: submission link.
Students who submit more than one file (i.e., the group’s submission and their own report) should package all files into a single zip file, and submit that; students who submit only their own report can submit it as it is.
Marking scheme#
The assignment is worth 20% of your final course mark, distributed as follows:
-
Code correctness and functionality: 8 marks
- Does the program read the data files correctly?
- Does the program correctly implement aggregation by month, for a specific month of the year, and extraction of daily observations?
- Does the program correctly implement the threshold calculation according to method (b)?
- Does the program correctly implement the threshold calculation according to method (a)?
- Does the program implement threshold calculation for extremely low as well as extremely high values?
-
Code organisation and readability: 6 marks
This includes:
- Functional decomposition. Is the functionality of the program partitioned into parts (functions) of reasonable size and complexity?
- Data structures and abstraction. Does the program use suitable data structures to store information? Does the design abstract from data representation to its meaning?
- Reuse/redundancy. Are there repeated parts of code that perform very similar functions, that could have been merged?
- Code documentation and commenting. Is there a suitable level of commenting? Is the functionality, assumptions and limitations of all main functions documented?
- Naming. Are function and variable names descriptive of their purpose or meaning?
-
User experience: 2 marks
- Is the user documentation readable, correct and complete?
- Is the program unnecessarily complicated to use? Does it require repetitive user input?
- Does the program present its output in an easy-to-read manner? Does the user documentation explain how to interpret the output, where it is not obvious from the output itself?
-
Individual report: 4 marks
Corrections and clarifications#
Typos and corrections:#
-
Typo: n is the number of entries in the time series, so it should be indexed X = x0, x1, .., xn-1.
-
In threshold definition (a), the two indices i and j are distinct (otherwise the condition would be trivially unsatisfiable for any F > 0).
File format#
-
All data files are in the same format as the three examples (same number of columns, same column headings, etc). Of course the contents (station number, dates, values) will differ.
-
You can assume that dates (the year, month and day) are present and valid for every entry, that dates are not repeating and that they are in increasing order.
-
You can also assume that there are no gaps in the dates in a file (i.e., if the first entry is 1970/01/01 and the last is 1970/12/31, then there should be 365 entries in the file); that is not saying that there is data for all those entries. (I haven’t verified if this assumption is actually true, so the clever thing to do would be to check it. But you can assume it without checking.)
Threshold computation method (a)#
Here is a re-formulation of threshold method (a):
-
If there are two indices i and j such that xi >= T and xj >= T and abs(i - j) < F, then T can not be the once-in-F threshold.
-
For given F, the threshold value is defined as the smallest value T that appears in the sequence and that is not ruled out by the test in the point above.
Thresholds for exceptionally low values#
If we want to compute a threshold for exceptionally low values, then:
Method (a): Find the greatest value xF in X such that for any two distinct indices i and j, if xi <= xF and xj <= xF then abs(j - i) >= F.
Method (b): xF is the (n / F):th smallest value in the series.
Missing data#
If the data field in a line is not blank, but the number of days field is, it is a single-day observation.
Missing data (in the data file) and “gaps” in the time series are not the same thing, and should not be confused. From the raw data, we want to produce a series of known totals for days, months or years. If data is missing, that means we will not know the exact total for some days, months or years. This is what introduces gaps in our series.
Because the raw data is a mix of single-day observations and totals over multiple days, it is sometimes possible to know the exact total for a month or a year without knowing the exact amount of rain that fell on each day of that month or year. For example, from the table with values for the beginning of December 1971 shown above, we know that there was 13.2 mm of rain in the first two days of the month and 2.5 mm in the following five days. That means we know (with certainty, and without making any assumptions, other than that the data is correct) that the total rainfall in the first 7 days of December 1971 was 15.7 mm. Of course, from this we can not infer that there was exactly 2.242857142857143 mm of rain on each day. This means that if we wanted to create a time series of daily totals, we would have to exclude all seven days at the start of this month.
The 1st of December 1971 was a Wednesday. This means that if we wanted to create a series of weekly (i.e., from Monday to Sunday) totals, we would not be able to know the total for the week from the 29th of November to the 5th of December, because the 5-day interval from the 3rd to the 7th spans both this week and the next: it could be that some, all, or none of the 2.5 mm that fell in those five days fell on days up to the 5th, i.e., during this week. See the following illustration:
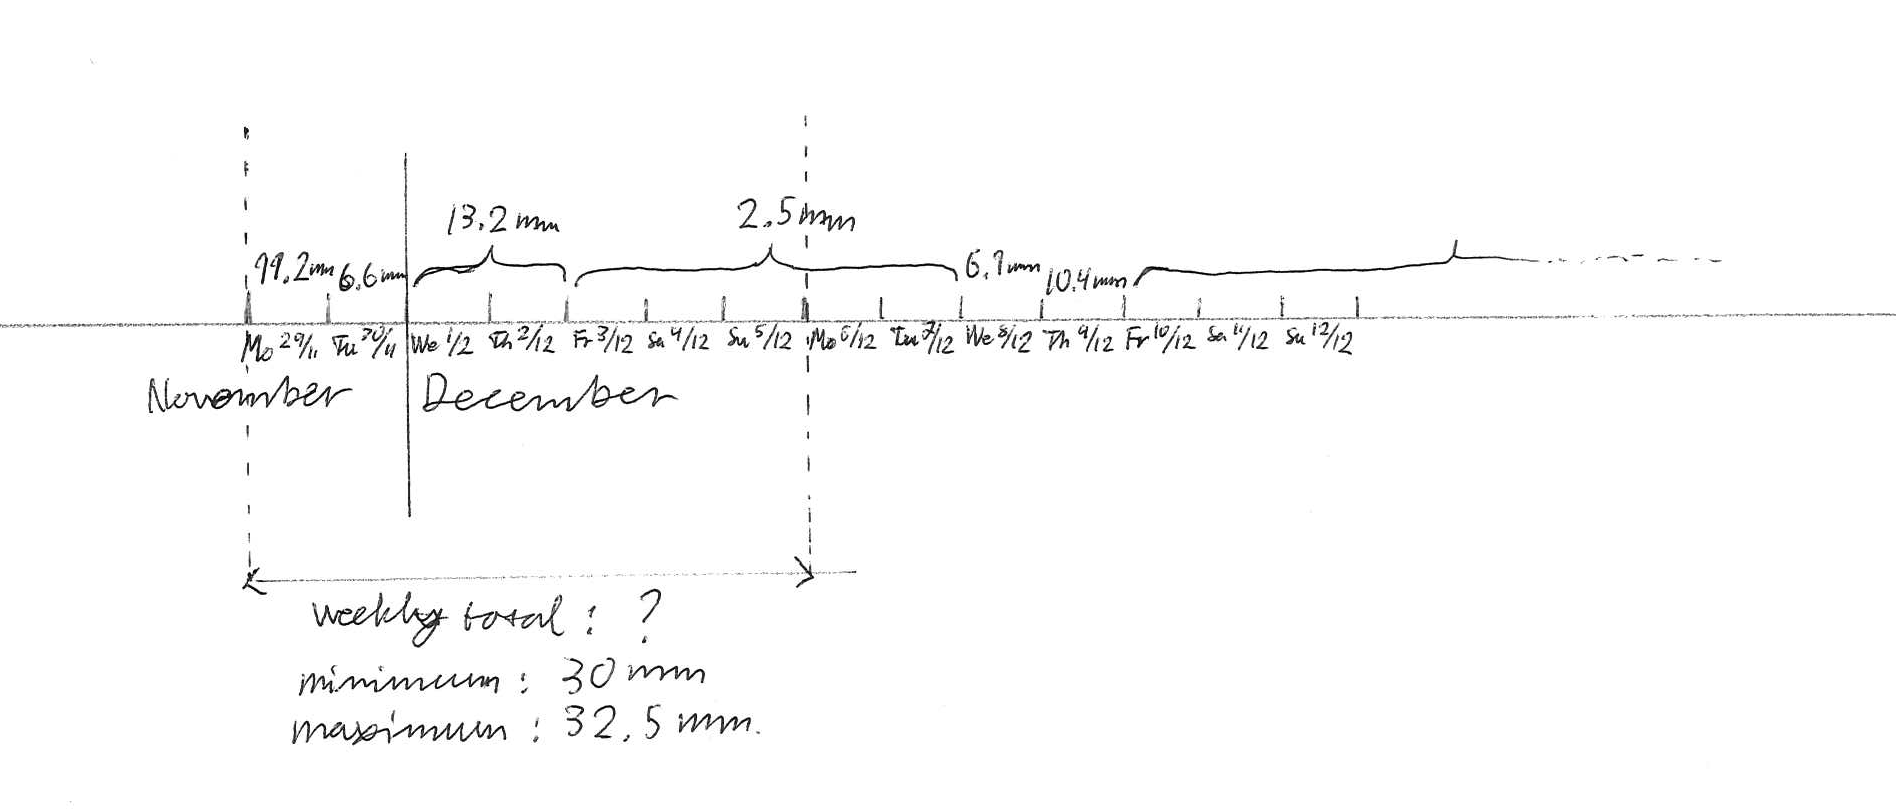
Note that in this case we are also not able to know the total for the following week either. It could, however, be possible to obtain the total for the month of December (and in fact it is) since there is no period of measurement over multiple days that crosses the boundary of the months (at this end). (Also, computing a weekly time series is not part of the assignment. We use the weekly totals in the example here just to keep the size of it small.)
Because the time series created from the data includes only the values that are known with certainty, there may be “gaps” in the series, meaning that the days/months/years are not consecutive. This is illustrated in the following graph:
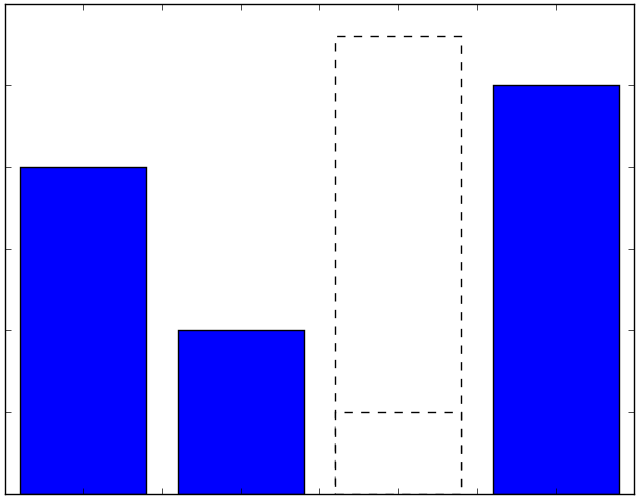
How we handle these gaps in the calculation of the threshold value is a question that is entirely separate from how they arise (as discussed above).
For the quantile threshold (definition (b)), it does not matter how near or far apart in time the values in the time series are. This definition only looks at the n/F largest (known) values.
For definition (a), it does matter, since this definition is based on how far apart the “peaks” in the series (values at or above the threshold) are. There are at least three ways we can handle this:
-
Ignore the gaps, i.e., read the series in the graph above as 4, 2, 5. This makes the distance between the two peaks (4 and 5) 2.
-
Count the gaps when determining the distance between two peaks. That means read the series in the graph above as 4, 2, ?, 5. This makes the distance between the peaks 3.
-
Give up and say that we cannot compute the threshold because we don’t know.
There is no “correct” way. Both of the first two options above are “wrong”, in the sense that they can return a threshold value that is different from what it would be if we knew the values at the points where there are gaps. There are other ways we can possibly deal with the gaps, but no method is perfect. However, just because no method is perfect it doesn’t mean that all of them are equally bad: The third option above is clearly useless, which the other two are not. What you have to do is choose one way to deal with the gaps (that is not useless), document it, and explain what the implications of the choice you made are.
Module use and testing#
-
We will test your program with the anaconda python installation that is on the CSIT lab computers. That means you can use any modules that are available in that environment. On the other hand, if your program does not work in this environment, we will consider it to be defective.
You may not require the installation of additional modules to run your program (even if you document how to install them).
-
We will test your program with other data than the three example files, but only with real data (i.e., no fake data with strange values that would never occur in reality).