Outline#
In this week’s lab you will:
- Learn about aggregate data types with structs and arrays in C
- Learn about data structure layout in memory
- Learn about dynamically allocating memory in C
- Practice writing code for traversing statically and dynamically allocated data structures in C
- Learn how to use GDB to debug programs
Preparation#
Open the lab2 directory in your local copy of your fork of the
lab pack 1 template repo in VS Code and continue on
with the lab.
If you don’t have a clone or fork, go back to the lab 1 preparation section and follow the instructions.
Exercise 1: Data Structures in C#
So far, we have only dealt with variables of a single data type. For example, we have written code to declare and manipulate integer and character variables. This tutorial will introduce grouping objects (or variables) of different data types into a single entity. Specifically, we will introduce structs in C. We will also practice writing code that involves structures.
Structs#
The C struct declaration creates a data type that group variables of different
types into a new type, referred to as an “aggregate type”.
The different components that make up the struct can be accessed via names.
Similar to arrays, the different components of a structure are stored in a
contiguous region in memory. A pointer to a struct is the address of its first
byte. As an example, consider the following declaration of a new data type
called record:
struct record {
  int id;
  char name[10];
};
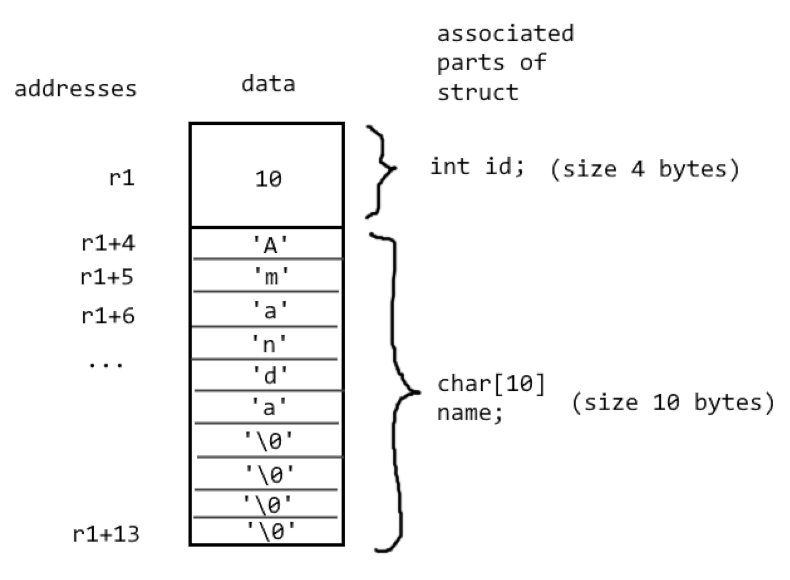
The above declaration of a struct creates a new structure called record.
The structure contains two “members”: a 4-byte variable of type int,
and a ten-element array of type char. Note that the character array is embedded
within the structure. The byte offset of the first character from the start of
the structure is 4 (an integer is 4 bytes).
The above struct declaration only defines a new type. No space is reserved in
memory yet for the members of the record structure. In fact, no record even
exists. We can define a new variable of type record and initialise its members
as follows:
struct record r1 = {10, "Amanda"};
Once a structure is both declared and a variable of its type defined, we can
reference (read or write) its members. We can use the dot operator (.) to
reference members of a structure. If we have a pointer to a structure, we can
reference its members with the structure pointer (->) operator. Consider the
following example,
struct record r1;
r1.id = 10;
r1.name = "Amanda";
In the above example, we have used the dot operator to initialise the members of the struct r1. Now, consider the following code,
struct record r1 = {10, "Amanda"};
struct record *r2 = &r1;
r2->id = 17;
r2->name = "Helen";
We first define a record r1 and initialise its members (the first statement). We then define a pointer with the type record and assign it the address of r1. The r2 pointer contains the memory address of the first element of the r1 structure. Now, we can use the -> operator to access (and read/update) r1 members via the r2 pointer. To properly access the second member (name) of the r1 structure (the third statement), the compiler will add the appropriate offset (4 bytes) to the starting address of r1. We call this process translation from the symbolic reference of a struct member (r2->name) to the appropriate memory address.
You may also recall structs from COMP2300 (though they were called “records” there). In memory, the above struct looks like this:
And in assembly, you may define it like this:
r1:
  .word 10 // int id
  .byte 'A' // char[10] name
  .byte 'm'
  .byte 'a'
  .byte 'n'
  .byte 'd'
  .byte 'a'
  .byte 0
  .byte 0
  .byte 0
  .byte 0 // padding to fill char array out to 10 bytes
Any instance of the same struct type will have the same members that all appear
at the same offset from the struct’s starting address.
Hence, given the base address r1 and the name of a particular member (e.g. id or name),
the compiler can figure out exactly where the associated data is in memory.
This is how the use of the -> operator in r1->id and r1->name works.
This also means a struct cannot have dynamically sized elements1 (i.e. size cannot change at runtime)! However, you can have a pointer in the struct which points to the dynamically sized object instead.
When defining a structure such as r1 above, it is cumbersome to prefix struct record before the variable name. C provides a facility called typedef for creating new data type names for convenience. The following declaration,
typedef struct record new_record;
makes the name new_record a synonym for struct record. We can then define a
new record variable as follows:
new_record r1 = {17, "Jack"};
When we pass structures to function as arguments, the whole structure (i.e., every member) is copied on the stack frame. It is more efficient to pass a pointer to the structure.
Open the program src/record.c and read the code. Try to guess the output of the program. Compile and run the program to check your guess.
Note that we have declared a new structure outside the main function. We have also declared several functions that we define later in the code (after the main function). Declaring the function header first before defining it in informs the compiler that we intend to define the function later (and use it before its definition in the code).
Open the program src/record.c and this time complete the definitions of the two functions equal and equal_with_copy. Both functions return 1 if the two structures passed as arguments are equal. Otherwise, they return 0. We define equality as follows:
- The integer ids are equal.
- The records contain similar names. It is up to you to decide how “similar” the names should be.
Use your string utility functions from the previous lab or an appropriate
function from string.h. This page
of the C reference contains information about the functions available in string.h.
Open the program src/buggy-record.c and read the code. There is a serious bug in the function create_record. This is due to a unique issue in C, which is that you can keep a pointer to a variable around even after its compile time lifetime/scope has passed, and the variable may no longer be valid.
Based on your understanding of how functions and their local variables behave in assembly, explain the bug.
Array of Structs#
We can declare an array of structs the same way we can declare arrays of ordinary types. The following declares and defines an array of 100 records:
new_record records[100];
We can access element of the records array the same way we access elements of ordinary arrays. The following example assigns an id of 40 to the tenth element of the records array,
records[9].id = 40;
Alternatively, we can use pointer arithmetic and add the appropriate offset to the starting address of the array of records. Consider the following
(records + 9)->id = 40;
As discussed before, the name of an array of type T is in essence a pointer of type T. When we add 9 to a pointer of type new_record, the compiler under the hood multiplies 9 by the size of the structure to access the tenth element of the array. The -> operator then accesses the id of that element.
What do you expect the sizeof operator to return when applied on the new_record type? Write a small program to test your understanding.
Exercise 2: Linked List#
We will now use C structures to build a simple linked list data structure.
A linked list is a data structure with a collection of elements (or nodes), and
each node contains a pointer to the next element in the list. A linked list
allows traversal over all its elements starting from the head node. To create
a linked list of records, we first need to add a new member to the structure
that points to the next element in the list. The revised declaration of the
record structure is as follows:
struct record {
  int id;
  char name[10];
  struct record *next;
};
The following code creates a linked list of three student records and connects them together into a linked list.
new_record student3 = {23, "Anson", NULL};
new_record student2 = {22, "Steve", &student3};
new_record student1 = {10, "Jack", &student2};
Note that student3 is the last element in the linked list and points to nothing. The NULL value is a built-in C constant that has a value of zero. In fact, it is a synonym for the character 0 used to terminate strings in C. Null can also be the value of a pointer, which is the same as zero.
Open the program src/linkedlist.c and compile and run the program. Observe carefully the definitions of the two functions to print the record and a linked list of records.
It is more convenient to have a function that adds a new record to the end of the linked list of records. So we can write code as follows:
new_record student1 = {10, "Jack", NULL};
new_record student2 = {22, "Steve", NULL};
new_record student3 = {23, "Anson", NULL};

insert(&student1, &student2);
insert(&student1, &student3);
Open the program src/linkedlist.c again and complete the function definition of the insert function. Test your function definition is correct by printing the linked list of records.
We would like to have the ability to delete records from the linked list given the values for the members of a record. Complete the definition of the delete_record function. The function takes the head node and integer id and name as arguments. If a record has matching id and name, it is deleted from the linked list. Test your code by printing the linked list.
What do you think would happen if we tried to delete the head of the linked list? Would we be able to?
Remember to push your work to GitLab, as this is one of the exercises the CI will test.
If you are getting stuck on this exercise and keep encountering segmentation faults, consider reading ahead to Exercise 5 to learn how to debug your code effectively.
Exercise 3: scanf#
Before moving any further, we would like to introduce the scanf function. The
scanf function receives formatted input from the terminal, in a similar way to
how printf prints formatted strings to the standard output. Consider the
following C code for receiving the user name and integer identifier from the
standard input or keyboard.
#include <stdio.h>

void main () {
  int id;
  char name[20];

  printf("Enter name: ");
  scanf("%19s", name);

  printf("Enter your identifier: ");
  scanf("%d", &id);

  printf("id = %d, name = %s \n", id, name);

  return 0;
}
Open the program src/scanf.c and read the code carefully to understand what the program is doing. Compile and run the program to make sure your understand how to use scanf in your C programs.
Exercise 4: Static vs. Dynamic Memory Allocation#
So far, we have only allocated memory for variables, arrays, and data structures on the call stack or simply the stack. Next, in this tutorial, we will see how we can allocate memory in the global data segment and the heap. Consider the following diagram showing the memory map of a typical program. The entire address space is typically divided into a number of segments. The figure explains the use of different segments.
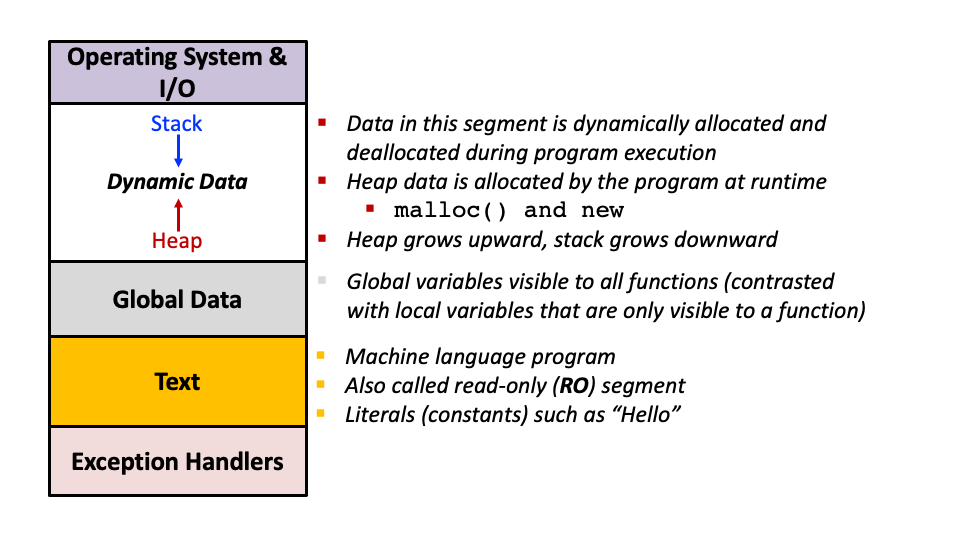
The dynamic data segment holds the stack and the heap. Recall that space for variables on the stack is allocated and deallocated automatically. Specifically, the space for variables on the stack is allocated when functions create new variables that cannot fit into the registers, and deallocated when functions return to their callers.
A heap is a large, subdividable block of memory that is managed by a memory manager. The heap stores data that is allocated by the program during runtime. The memory allocated on the heap is also called dynamically allocated memory. Such memory is used when the exact memory requirements for a program are unknown before runtime (i.e., when the program is written or when it is being compiled). The lifetime of heap objects extend from when they are allocated by the programmer and until they are deallocated explicitly by the programmer. Let’s explore the reasons we need a heap further.
Statically Allocated Memory#
Every object in C has a storage duration that determines its lifetime (i.e., how long it lasts during program execution). Objects declared in file scope in C have static duration or lifetime (a.k.a. storage duration). Such objects (scalar variables, arrays, and data structures) are allocated in the global data segment of the process’ address space. The benefit of declaring variables with global scope is that they can be accessed from anywhere in the source code. The storage duration of such variables lasts the entire execution of the program. (Note here that variables on the stack have automatic storage duration, but we do not need to explicitly specify this duration when declaring variables in C programs. Here, automatic implies the stack space grows and shrinks automatically in response to functions executing and exiting.)
Open the program src/static-array.c and familiarise yourself with the program.
Once you have understood the example program, answer the following questions:
-
Where are the
incfunction’s variablesstatic_intandstack_intstored? -
What is the difference between a variable allocated inside the
mainfunction and a variable allocated at the file scope, outside of any function? -
The
global_arrayis globally visible to any function in the source program. Unfortunately, it’s length is fixed at compile time. What should we do if we want a globally visible variable-length array? -
What are the disadvantages of allocating very large arrays on the stack frame? What are some of the limitations of allocating objects on the stack frame?
Check your answers with a tutor in your lab.
Dynamic Memory Allocation#
We hope you understand the motivation for the program heap while answering the questions above. Now, we will show you and practice dynamically allocating memory on the program heap. Once again, dynamically allocated memory is used when the exact memory requirements of a program are unknown at compile time. Dynamically allocated memory has allocated storage duration. The lifetime of an allocated object extends from its allocation until its deallocation.
Growing the stack downward and the heap upward makes the management of the dynamic data segment easy. Of course, the operating system ensures that stack and the heap never grow into each other.
An easy example of a program that does not know its memory requirements at compile time is a text editor - the program does not know how many words the user is going to type.
The C standard library defines memory management functions for allocating and deallocating (freeing) heap memory. The functions we are concerned with include malloc and free. The malloc function allocates space for an object of a specified size. The size is specified in terms of the number of bytes of memory to be allocated. The malloc function returns a pointer to the starting address of the newly allocated memory. The sizeof operator is really useful for specifying the size of memory to be allocated. The following examples allocate memory on the heap for ten integers, ten characters, and ten structures.
struct student {
  int id;
  char name[20];
};

typedef struct student student_t;

int *int_array = (int *) malloc(10 * sizeof(int));
char *char_array = (char *) malloc(10 * sizeof(char));
student_t *struct_array = (student_t *) malloc(10 * sizeof(student_t));
The malloc function returns NULL if the heap is full. Otherwise, it returns a (void) pointer to the allocated space. Note that in each case in the example above, we cast the pointer returned by malloc to a pointer to the type of the declared object.
A careful programmer must deallocate dynamically allocated memory when it’s no longer needed by calling the free function.
Why is it important to deallocate unused heap memory?
Open the program src/item-array.c and read the code. How big is item_t? What is the total amount of memory consumed by the item_array? Recalculate the consumption accounting for the sizes of individual members contained in each item in the item_array. Can you draw how the item_array looks like on the heap?
Two-Dimensional Array#
We will now dynamically allocate a 2-dimensional array (matrix) with N rows and M columns on the heap. We provide the partial code for the exercise in src/2-dim-array.c. Your task is to initialize each array element to a calculated value, then free the array from memory. This exercise is fairly similar to the previous exercise, with a subtle difference in its solution when freeing memory that is both severely consequential and easy to miss.
Follow the instructions in src/2-dim-array.c and complete the program. Check your solution with a tutor when complete.
Linked List with Dynamic Memory#
We will now revisit the linked list program. We have rewritten the program to ask the user if there is another student to be added to the list. If the user types 1, we then ask for additional details regarding the student’s record, and create and add a new student to the linked list. At any point, if the user types a -1, we terminate the program. This program demonstrates the true power of dynamic allocation. Indeed, we have no clue at compile time, how many students the user intends to add to the linked list. We dynamically allocate memory for each student’s record as the user wishes.
If the user types 2, the program asks for the details of the student’s record and removes the appropriate element from the list.
In order to create and destroy linked list elements, you will need to use malloc and free respectively. There are a few other subtle differences this time that are worth noting:
-
The
insertanddeleteoperate on the listhead, which is a globally defined variable. Thus it is no longer passed as a function argument, and can be modified from within the function. -
Because
headis globally defined and modifiable by functions, you should be able to delete any element of the list - including the first element. -
headis initially aNULLpointer - Your insert function should not assume thathead -> nextexists, as it will not exist when the list is empty.
Open the program src/linkedlist-dynamic.c and complete the definitions of insert() and delete().
When you are done push your code to GitLab to verify that it passes the CI test.
The CI test checks a couple of tricky edge cases.
If the test is failing and you aren't sure why, click here to see the input the CI test is using.
1
623
Adnan
1
248
Alex
1
30
Christo
1
164
Itay
1
829
Lavender
1
311
Sam
1
451
Sophie
1
380
Yuki
2
311
Sam
2
380
Yuki
2
129
Itay
2
623
Adnan
-1
If you don’t want to type all of that in manually, you can save it in a file in
the lab3 directory (e.g input.txt) and invoke your program as:
./linkedlist-dynamic < input.txt
Most students have solved the linked list exercise with an iterative program using loops. Could you solve the exercise using recursion?
Exercise 5: Memory Bugs and GDB#
The C programming language requires manual memory management (unlike languages
like Java and Python, which offer some form of automatic memory management).
In C, the programmer needs to track when an object is no longer needed and can
be safely freed. Not freeing dead objects leads to memory leaks and the
inefficient use of physical (main) memory. Memory leaks can even lead to dreadful
out-of-memory errors. Unfortunately, programmers frequently make mistakes and
either forget to free memory or free it prematurely.
Your task in this section is to identify and fix all the memory errors in the provided program. The program declares three arrays at run-time with malloc, initializes their elements to zero, and frees them. There are many bugs in the program. You are to use your intuition about how pointers and dynamic memory allocation work to fix as many bugs as possible.
Open src/bug-galore.c and take a read through. Try compiling and running it. What happens? Don’t start debugging just yet; read the next part about GDB first!
But first: an interlude about the GNU Debugger (GDB)!
GDB#
GDB is the primary debugger we will use in this course. Its basic functionality, stepping through code line by line and printing values of variables to check them, should be familiar to you from your experience with the Java debugger in COMP1110 and ARM assembly debugger in COMP2300. We will teach you something you likely have not seen before though: how to use the debugger straight from the terminal. This is in fact the best way to access some of GDB’s most powerful features, such as thread debugging (which will be useful in the course’s second half).
If you are using a Mac, then GDB may not be available on your device. On a Linux install or WSL, you should be able to use apt install gdb if you haven’t
already, and then running just the command gdb should work. If it says command not found, you’re out of luck.
Fortunately, there is an alternative debugger with much the same functionality called LLDB. See this website to see what the equivalent LLDB commands are for the GDB commands discussed below.
Once you’ve compiled bug-galore.C, running it in gdb is as simple as below:
% gdb ./bug-galore
If successful, you should see something like:
Reading symbols from ./bug-galore...
(gdb)
The ‘symbols’ being read here are debug symbols. Normally, your program when compiled is raw assembly. But when you debug,
you want to know information like which line in the source file you are currently running, which is normally lost when
compiling. The -g flag in the CC commands in the Makefile adds in extra information like this, which greatly smoothens
the debugging process.
The (gdb) indicates that you are in the debugger, and that it is waiting for you to type a debugging command.
Currently gdb isn’t running the process. To do so, type in the command:
(gdb) r
Debugger commands usually have short versions, especially if they are commands used frequently. For example, r is a shorthand for the command run.
The program will run through and promptly crash. Unlike what happened when you ran it normally though, it will now show you exactly where it crashed!
[Thread debugging using libthread_db enabled]
Using host libthread_db library "/lib/x86_64-linux-gnu/libthread_db.so.1".
1 1 1 1 1 1 1 1 1 1 49
1431655769 5 1722924430 -1712713788 1 1 1 1 1 1 49
free(): double free detected in tcache 2

Program received signal SIGABRT, Aborted.
__pthread_kill_implementation (no_tid=0, signo=6, threadid=140737351448384) at ./nptl/pthread_kill.c:44
44      ./nptl/pthread_kill.c: No such file or directory.
Bah! What in the world is ./nptl/pthread_kill.c:44? It is showing you the location it crashed in the topmost function it was in when it executed, but here, the topmost level function was some random standard library function. To see where it was up to in the main program, type in the command bt (for backtrace), which prints the “call stack”:
(gdb) bt
#0  __pthread_kill_implementation (no_tid=0, signo=6, threadid=140737351448384) at ./nptl/pthread_kill.c:44
#1  __pthread_kill_internal (signo=6, threadid=140737351448384) at ./nptl/pthread_kill.c:78
#2  __GI___pthread_kill (threadid=140737351448384, signo=signo@entry=6) at ./nptl/pthread_kill.c:89
#3  0x00007ffff7db4476 in __GI_raise (sig=sig@entry=6) at ../sysdeps/posix/raise.c:26
#4  0x00007ffff7d9a7f3 in __GI_abort () at ./stdlib/abort.c:79
#5  0x00007ffff7dfb676 in __libc_message (action=action@entry=do_abort, fmt=fmt@entry=0x7ffff7f4db77 "%s\n") at ../sysdeps/posix/libc_fatal.c:155
#6  0x00007ffff7e12cfc in malloc_printerr (str=str@entry=0x7ffff7f506f0 "free(): double free detected in tcache 2") at ./malloc/malloc.c:5664
#7  0x00007ffff7e150ab in _int_free (av=0x7ffff7f8cc80 <main_arena>, p=0x555555559290, have_lock=0) at ./malloc/malloc.c:4473
#8  0x00007ffff7e17453 in __GI___libc_free (mem=<optimised out>) at ./malloc/malloc.c:3391
#9  0x00005555555552ba in main () at src/bug-galore.c:39
So the crash was at line 39, which is free(array2)! The error message likely already told you what happened though: you freed the same pointer twice, and indeed we see the second free(array2) on line 35. Changing this is not so easy, because just deleting this line still leaves array1 unfreed;
we’ll leave the fix to you to figure out.
You will also notice another error: when printing array1 and array2, they contain 1s instead of 0s (and in fact some garbage number is also being printed).
Let us investigate; run the command b bug-galore.c:31 to place a breakpoint (what b stands for) on line 31 of the file, right before we enter the print
function. Then run r to run the program. and you’ll see it stop on the line you specified.
(gdb) b bug-galore.c:31
Breakpoint 1 at 0x555555555282: file src/bug-galore.c, line 31.
(gdb) r
The program being debugged has been started already.
Start it from the beginning? (y or n) y
Starting program: /students/u7300623/Desktop/comp2310-tutoring/comp2310-2025-labs-dev/lab2/bug-galore
[Thread debugging using libthread_db enabled]
Using host libthread_db library "/lib/x86_64-linux-gnu/libthread_db.so.1".

Breakpoint 1, main () at src/bug-galore.c:31
31        print_array(array1);
Now run p (the print command). This is a very versatile command that allows
you to print expressions. You can print the address of the pointer array1, or
(using the deref operator) print the value at the address. You can even print
the value at the next address!
(gdb) p array1
$3 = (int *) 0x5555555592a0
(gdb) p *array1
$4 = 1
(gdb) p *(array1 + 1)
$5 = 1
Here you can see that the print function was not wrong; the array really is full of 1s. How can this be? Hint: the culprit is the zero_initialize function.
We will leave the rest of the bugs for you to solve, but here are a few more handy commands as well as a summary of the ones we already discussed:
r: run the programb filename.C:N: place a breakpoint in the source filefilename.Cat line numberNb funcname: place a breakpoint at the start of the functionfuncname.b mainis very useful.p expr: print an expression’s valuen: (once stopped) step to the next line in current function (skipping over function calls)s: (once stopped) step to the next line in code, including stepping INTO functions when they are called.c: continue running after stopped on a breakpointinfo break: print a list of existing breakpoints and their numbersd N: delete breakpoint Nq: quit the debugger
Also, if you are debugging a program which has arguments, then they need to be passed like this when first running GDB:
gdb --args ./program arg1 arg2 arg3
For a handy reference for all of these as well as a description of some more commands, see the GDB cheat sheet.
Debugging in VSCode#
If you’re really not a fan of terminal GDB, you can debug through VSCode. If you successfully installed codeLLDB in software setup, then as long as you have the lab folder open correctly (with the .vscode directory in the root), you will be able to use the debugger from VSCode by running “Launch” from the Run and Debug window as long as the file you want to debug is the one you currently have open in the editor.
This will work similarly to the COMP2300 debugger; you can set breakpoints by clicking on lines in the gutter, you can step through or into functions, et cetera. See this page for a refresher on how to use that debugger (ignore the assembly-specific sections).
However, we recommend using the terminal GDB since it is much more powerful.
Armed with GDB and your knowledge of memory bugs, solve all of the memory bugs in src/bug-galore.c.
If you have reached this point, you have finished all the content from this lab. Great work!
Remember to push your work to GitLab.
-
There is one exception! If you have looked closely at the C Reference, you may have noticed the section on “flexible array members”. ↩